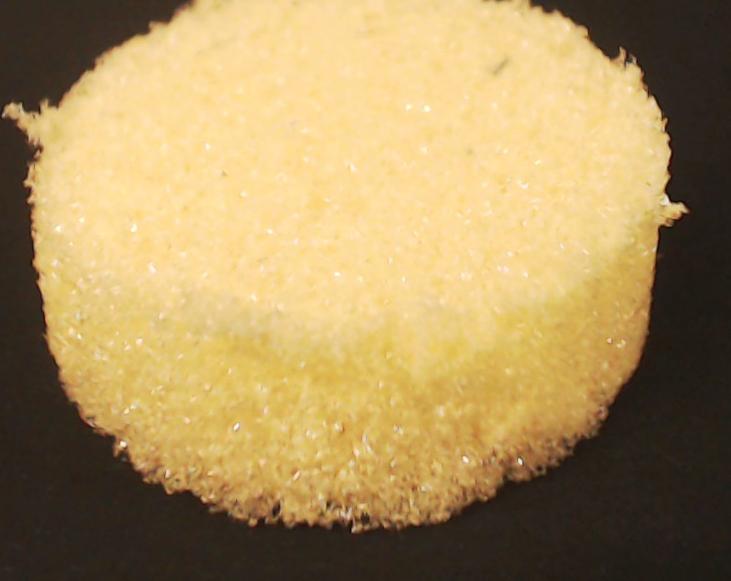
INS12
Material description
Material ID: INS12
Material type: Polyurethane flexible foam (PU) - organic foam insulation
Polymer: Polyurethane (82%)
Additives (fire retardants, fillers or traces of inorganic elements): Chlorine (17%), Phosphorus (1%), traces of other elements (<1%)
Core thickness: 51.71mm
Thickness of single metal skin: 1.5-2.0mm
| Compound | Mass Concentration (%) |
|---|---|
| Polyurethane (PU) | 82 |
| Chlorine (Cl) | 17 |
| Phosphorus (P) | 1 |
| Traces of sulfur (S) | <1 |
| Traces of silicon (Si) | <1 |
| Traces of sodium (Na) | <1 |
| Traces of potassium (K) | <1 |
| Traces of aluminium (Al) | <1 |
Metal skin is 1.5mm on one side and 2.0mm on the other.
A. Material composition identification
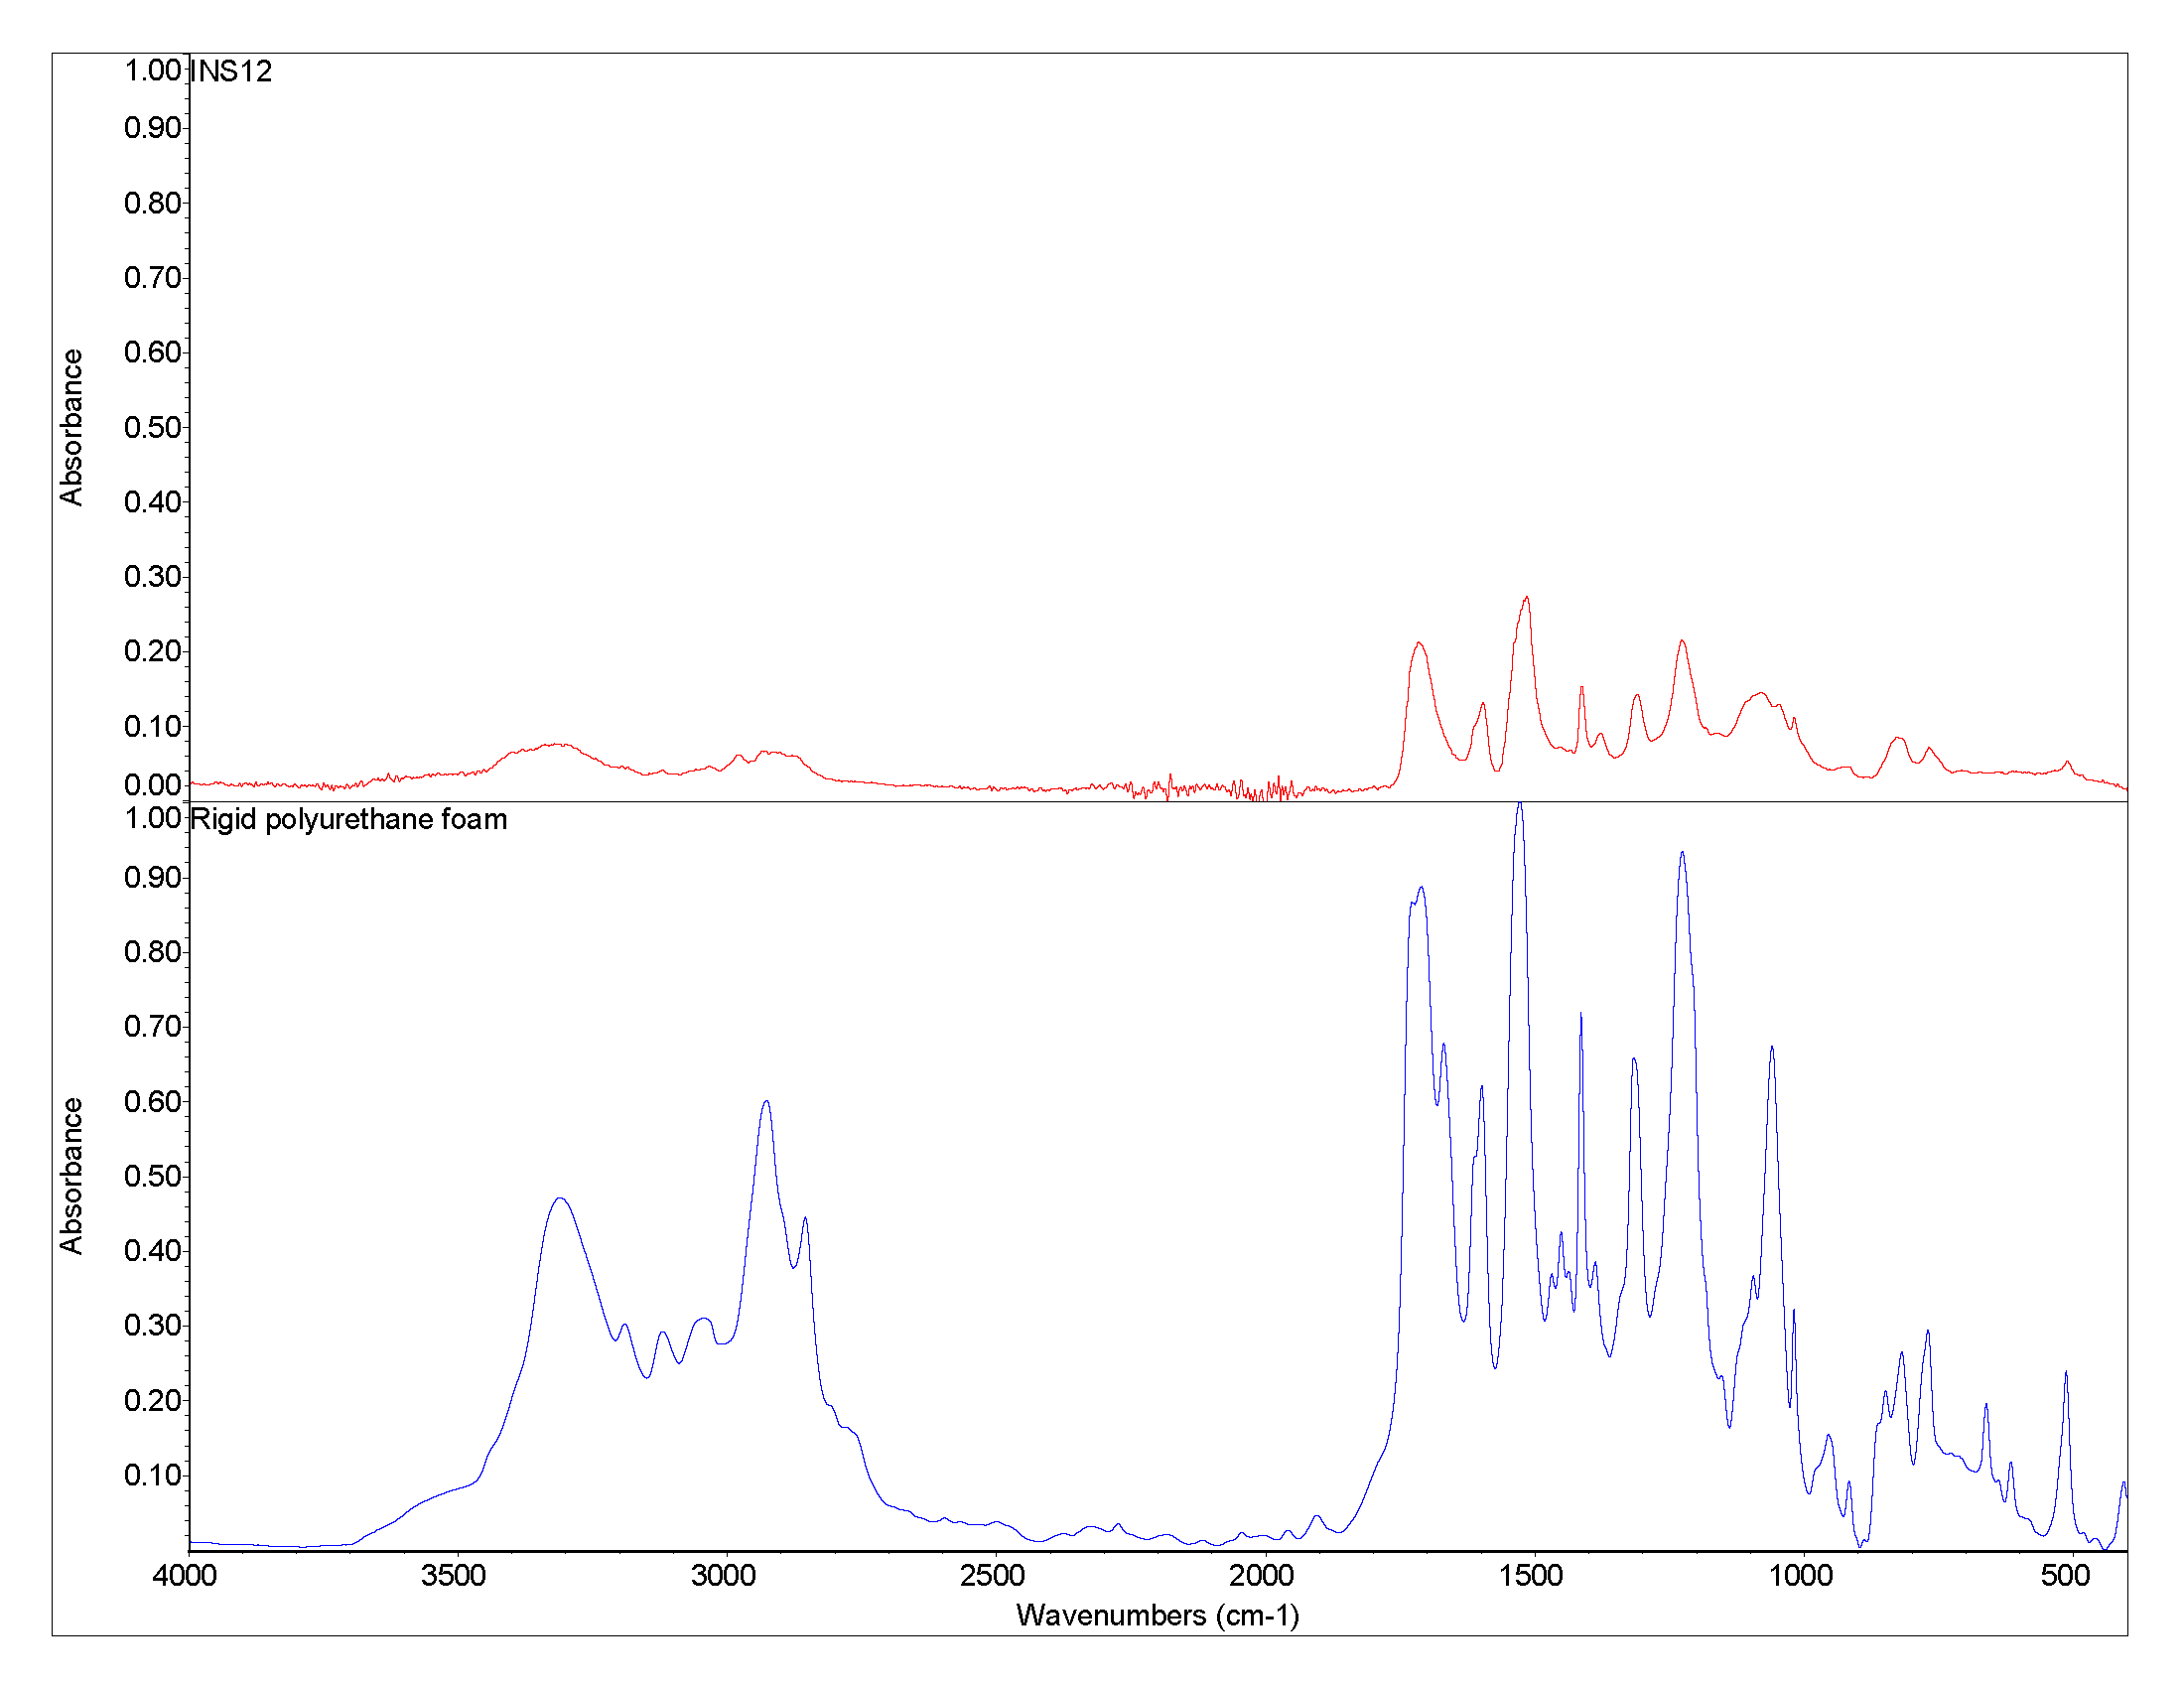
A.1 Attenuated total reflection – Fourier transform infrared spectroscopy (ATR-FTIR)
Table 2. FTIR compound identification.| Identified Compounds |
|---|
| Rigid polyurethane foam (PU) |

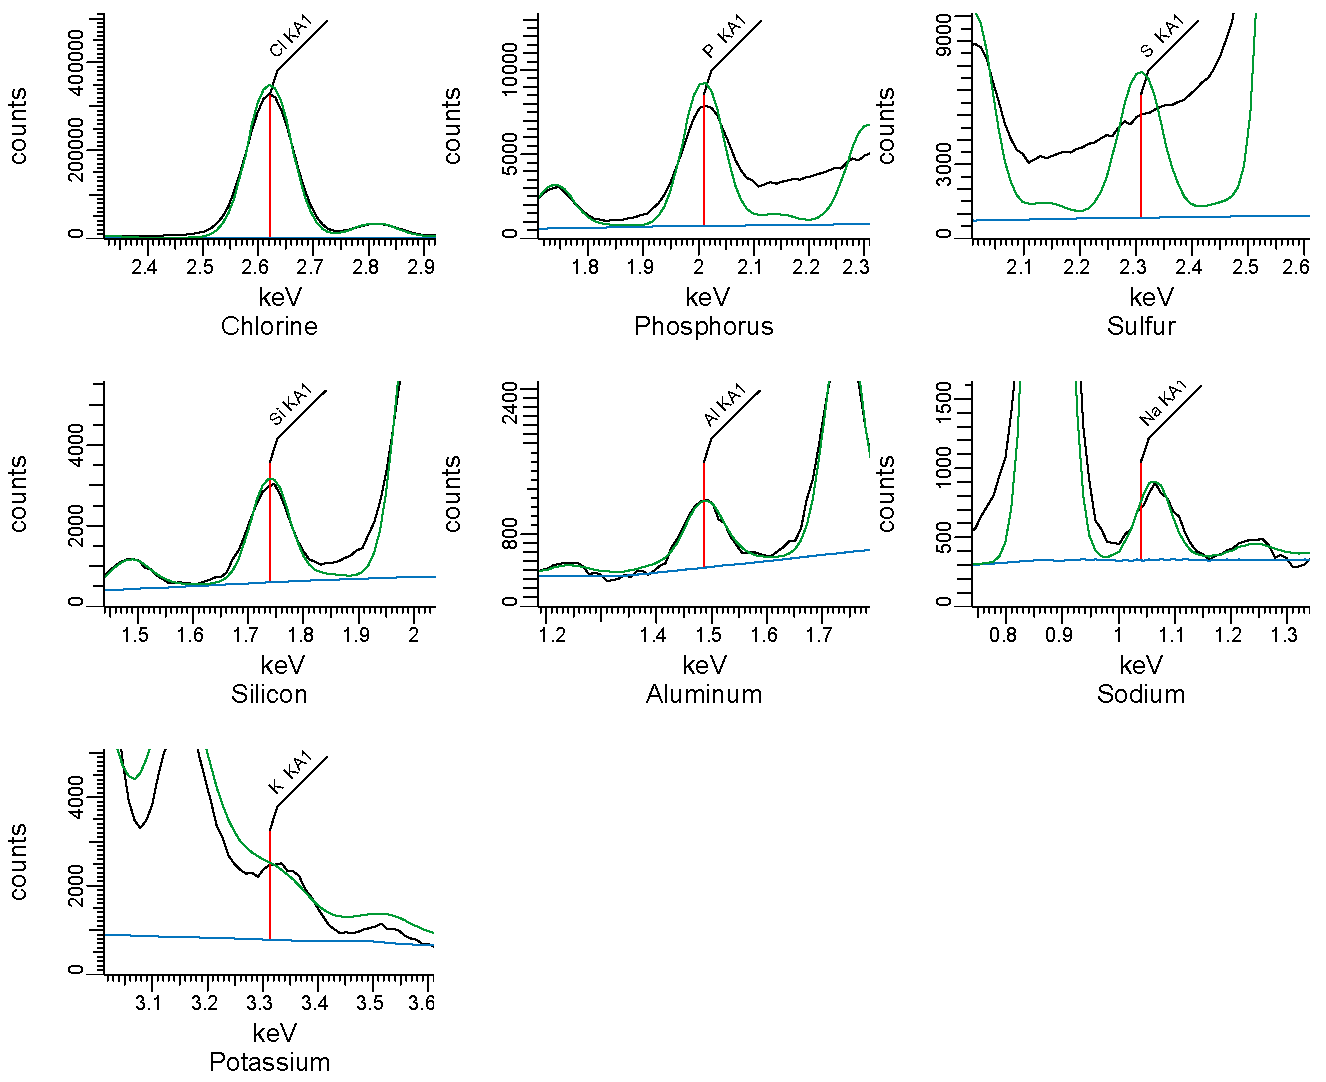
A.2 Energy Dispersive X-Ray Fluorescence (EDXRF)
Table 2. Inorganic elements and their mass concentration identified with EDXRF.| Element | Mass Concentration (%) |
|---|---|
| Cl | 17 |
| P | 1 |
| S | <1 |
| Si | <1 |
| Na | <1 |
| K | <1 |
| Al | <1 |
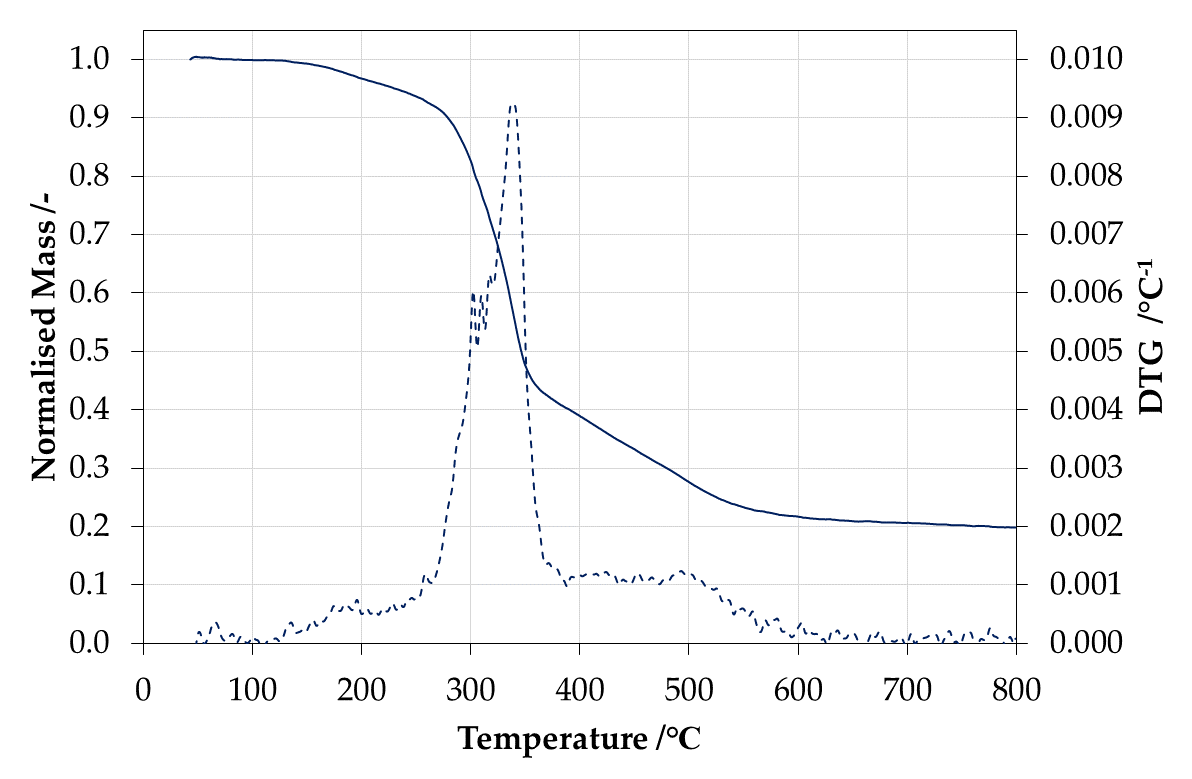
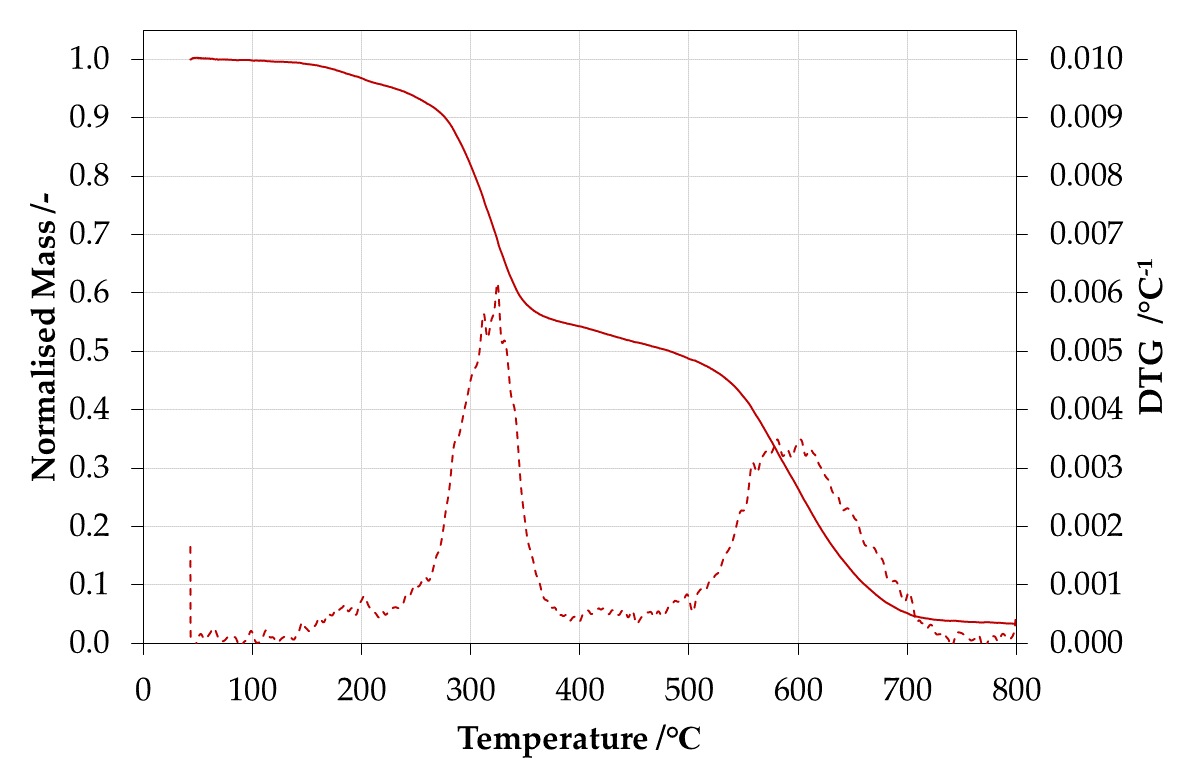
B. Thermogravimetric analysis
Table 3. Mass fraction of residue after thermal decomposition.| Condition | Fraction of mass residue at 800°C |
|---|---|
| Non-oxidative (nitrogen) | 0.20 |
| Oxidative (air) | 0.03 |
| Peak ID | Temperature peak (°C) | Amplitude of peak (°C-1) |
|---|---|---|
| Peak 1 | 338 | 9.24 x 10⁻³ |
| Peak 2 | 493 | 1.24 x 10⁻³ |
| Peak ID | Temperature peak (°C) | Amplitude of peak (°C-1) |
|---|---|---|
| Peak 1 | 324 | 6.17 x 10⁻³ |
| Peak 2 | 581 | 3.49 x 10⁻³ |
C. Gross Heat of Combustion
Table 7. Gross Heat of Combustion individual results for sample.| Trial | ΔHc [kJ g-1] |
|---|---|
| Trial 1 | 26.88 |
| Trial 2 | 26.74 |
| Trial 3 | 26.49 |
| Average | 26.70 |
| Std dev | 0.19 |
D. Ignition parameters
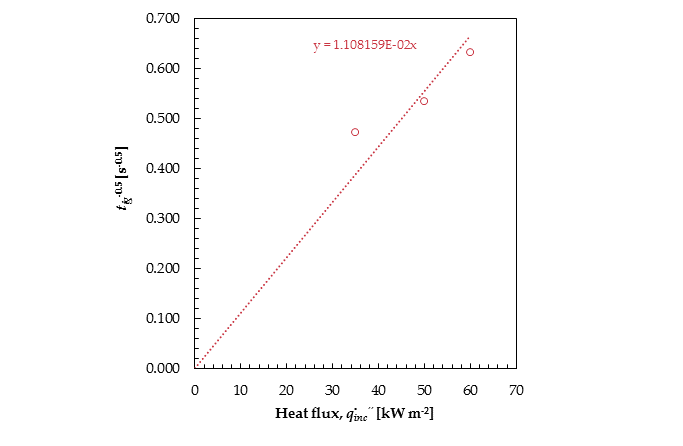
Table 8. Summary of ignition parameters for sample.| Critical heat flux for ignition | Ignition temperature | Total heat transfer coefficient of losses | Apparent thermal inertia |
|---|---|---|---|
| q̇″cr [kW m−2] | Tig [°C] | hr [W m-2 K-1] | kρc [kW2 m-4 K-2 s] |
| 12.50 | 336 | 35.60 | 0.084 |
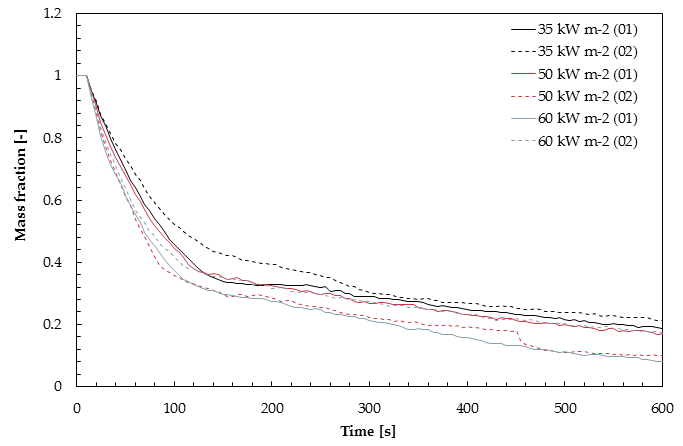
E. Burning behaviour
Table 9. Summary of key burning behaviour metrics.| Heat flux | Test | Time to ignition | Fraction of mass residue | Peak heat release rate | Total energy released |
|---|---|---|---|---|---|
| q̇″inc [kW m-2] | tig [s] | mres [-] | q̇″p [kW m-2] | Qt [MJ m-2] | |
| 35 kW m-2 | |||||
| Test 1 | 5 | - | 169.64 | 23.18 | |
| Test 2 | 4 | 0.19 | 175.41 | 26.15 | |
| Avg | 4 | 0.10 | 172.53 | 24.66 | |
| 50 kW m-2 | |||||
| Test 1 | 4 | 0.14 | 213.48 | 26.43 | |
| Test 2 | 3 | 0.09 | 214.76 | 22.27 | |
| Avg | 4 | 0.12 | 214.12 | 24.35 | |
| 60 kW m-2 | |||||
| Test 1 | 2 | 0.06 | 236.48 | 24.36 | |
| Test 2 | 3 | 0.15 | 246.69 | 27.87 | |
| Avg | 2 | 0.11 | 241.59 | 26.11 | |
| 80 kW m-2 | |||||
| Test 1 | - | - | - | - | |
| Test 2 | - | - | - | - | |
| Avg | - | - | - | - |

| Test | ΔHc [kJ g-1] |
|---|---|
| 35 kW m-2 (Test 1) | 18.11 |
| 35 kW m-2 (Test 2) | 23.48 |
| 50 kW m-2 (Test 1) | 22.10 |
| 50 kW m-2 (Test 2) | 21.34 |
| 60 kW m-2 (Test 1) | 20.14 |
| 60 kW m-2 (Test 2) | 23.03 |
| 80 kW m-2 (Test 1) | - |
| 80 kW m-2 (Test 2) | - |
| Average | 21.37 |
| Std dev | 2 |
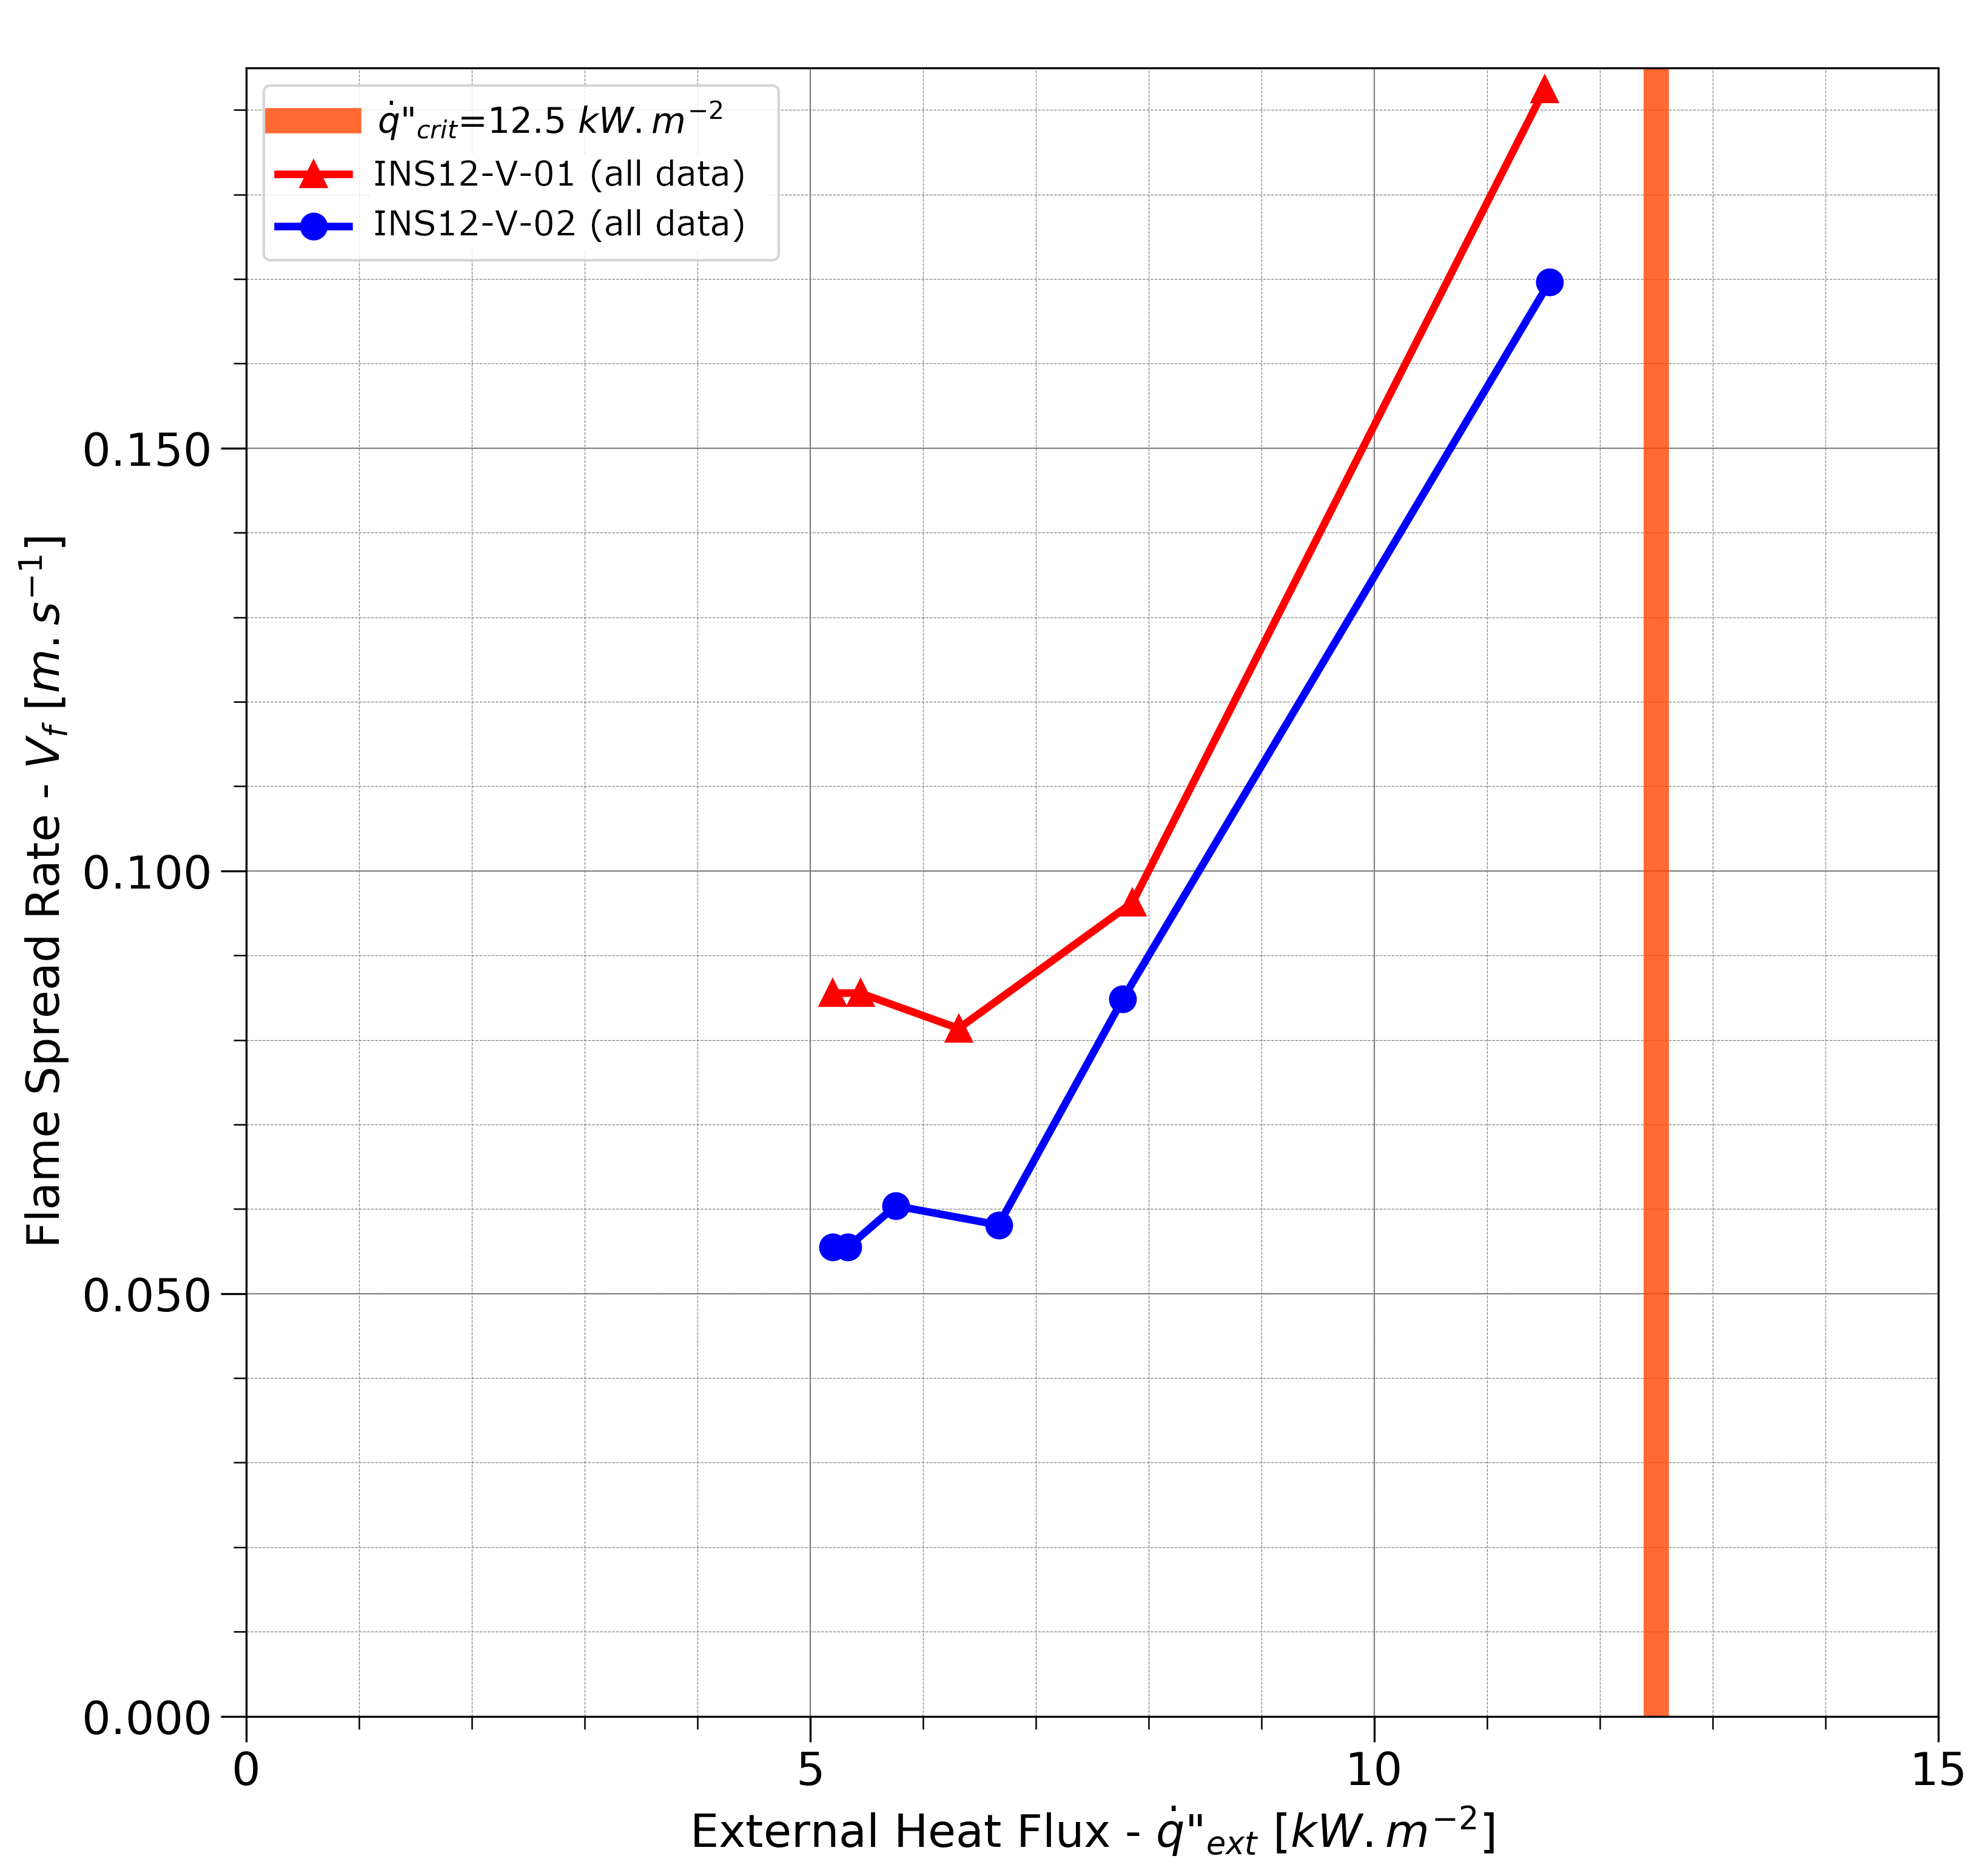
F. Flame Spread
Table 11. Minimum heat flux for flame spread rate and minimum flame spread rate for sample.| Orientation | q̇″min.spread [kW m-2] | Vf.min [mm s-1] |
|---|---|---|
| Horizontal | 3.80 | - |
| Vertical | 5.20 | - |
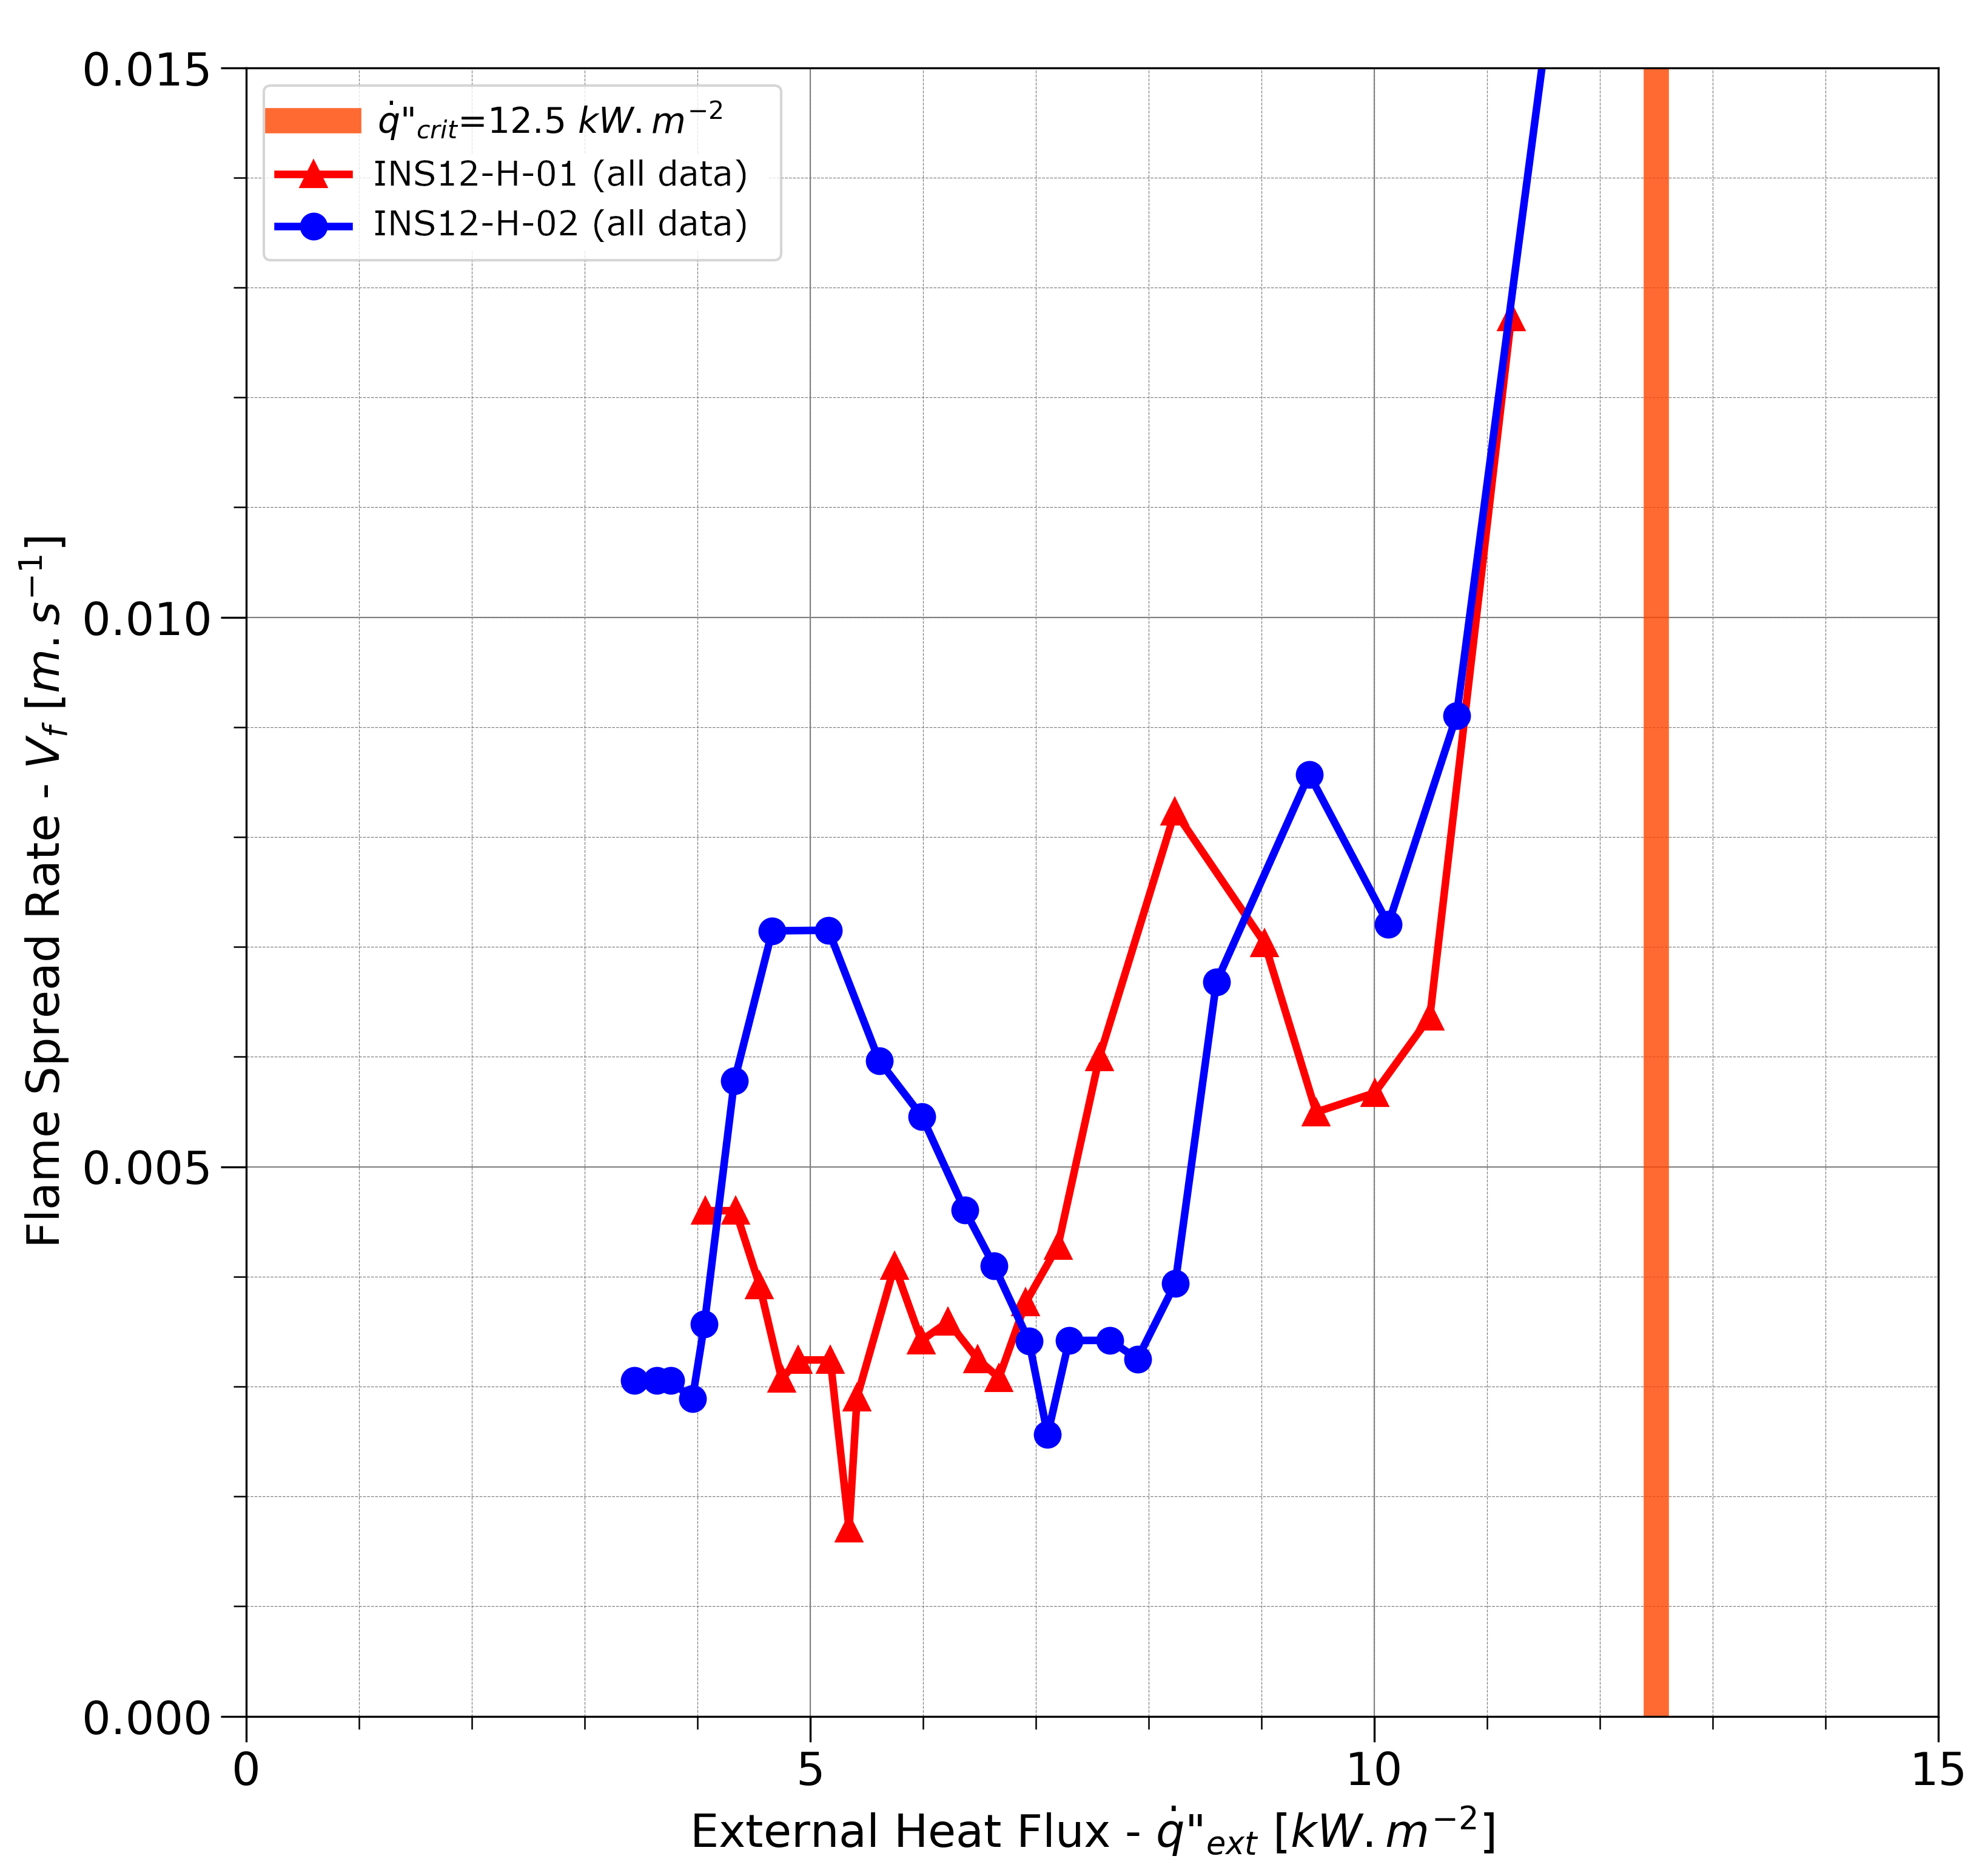
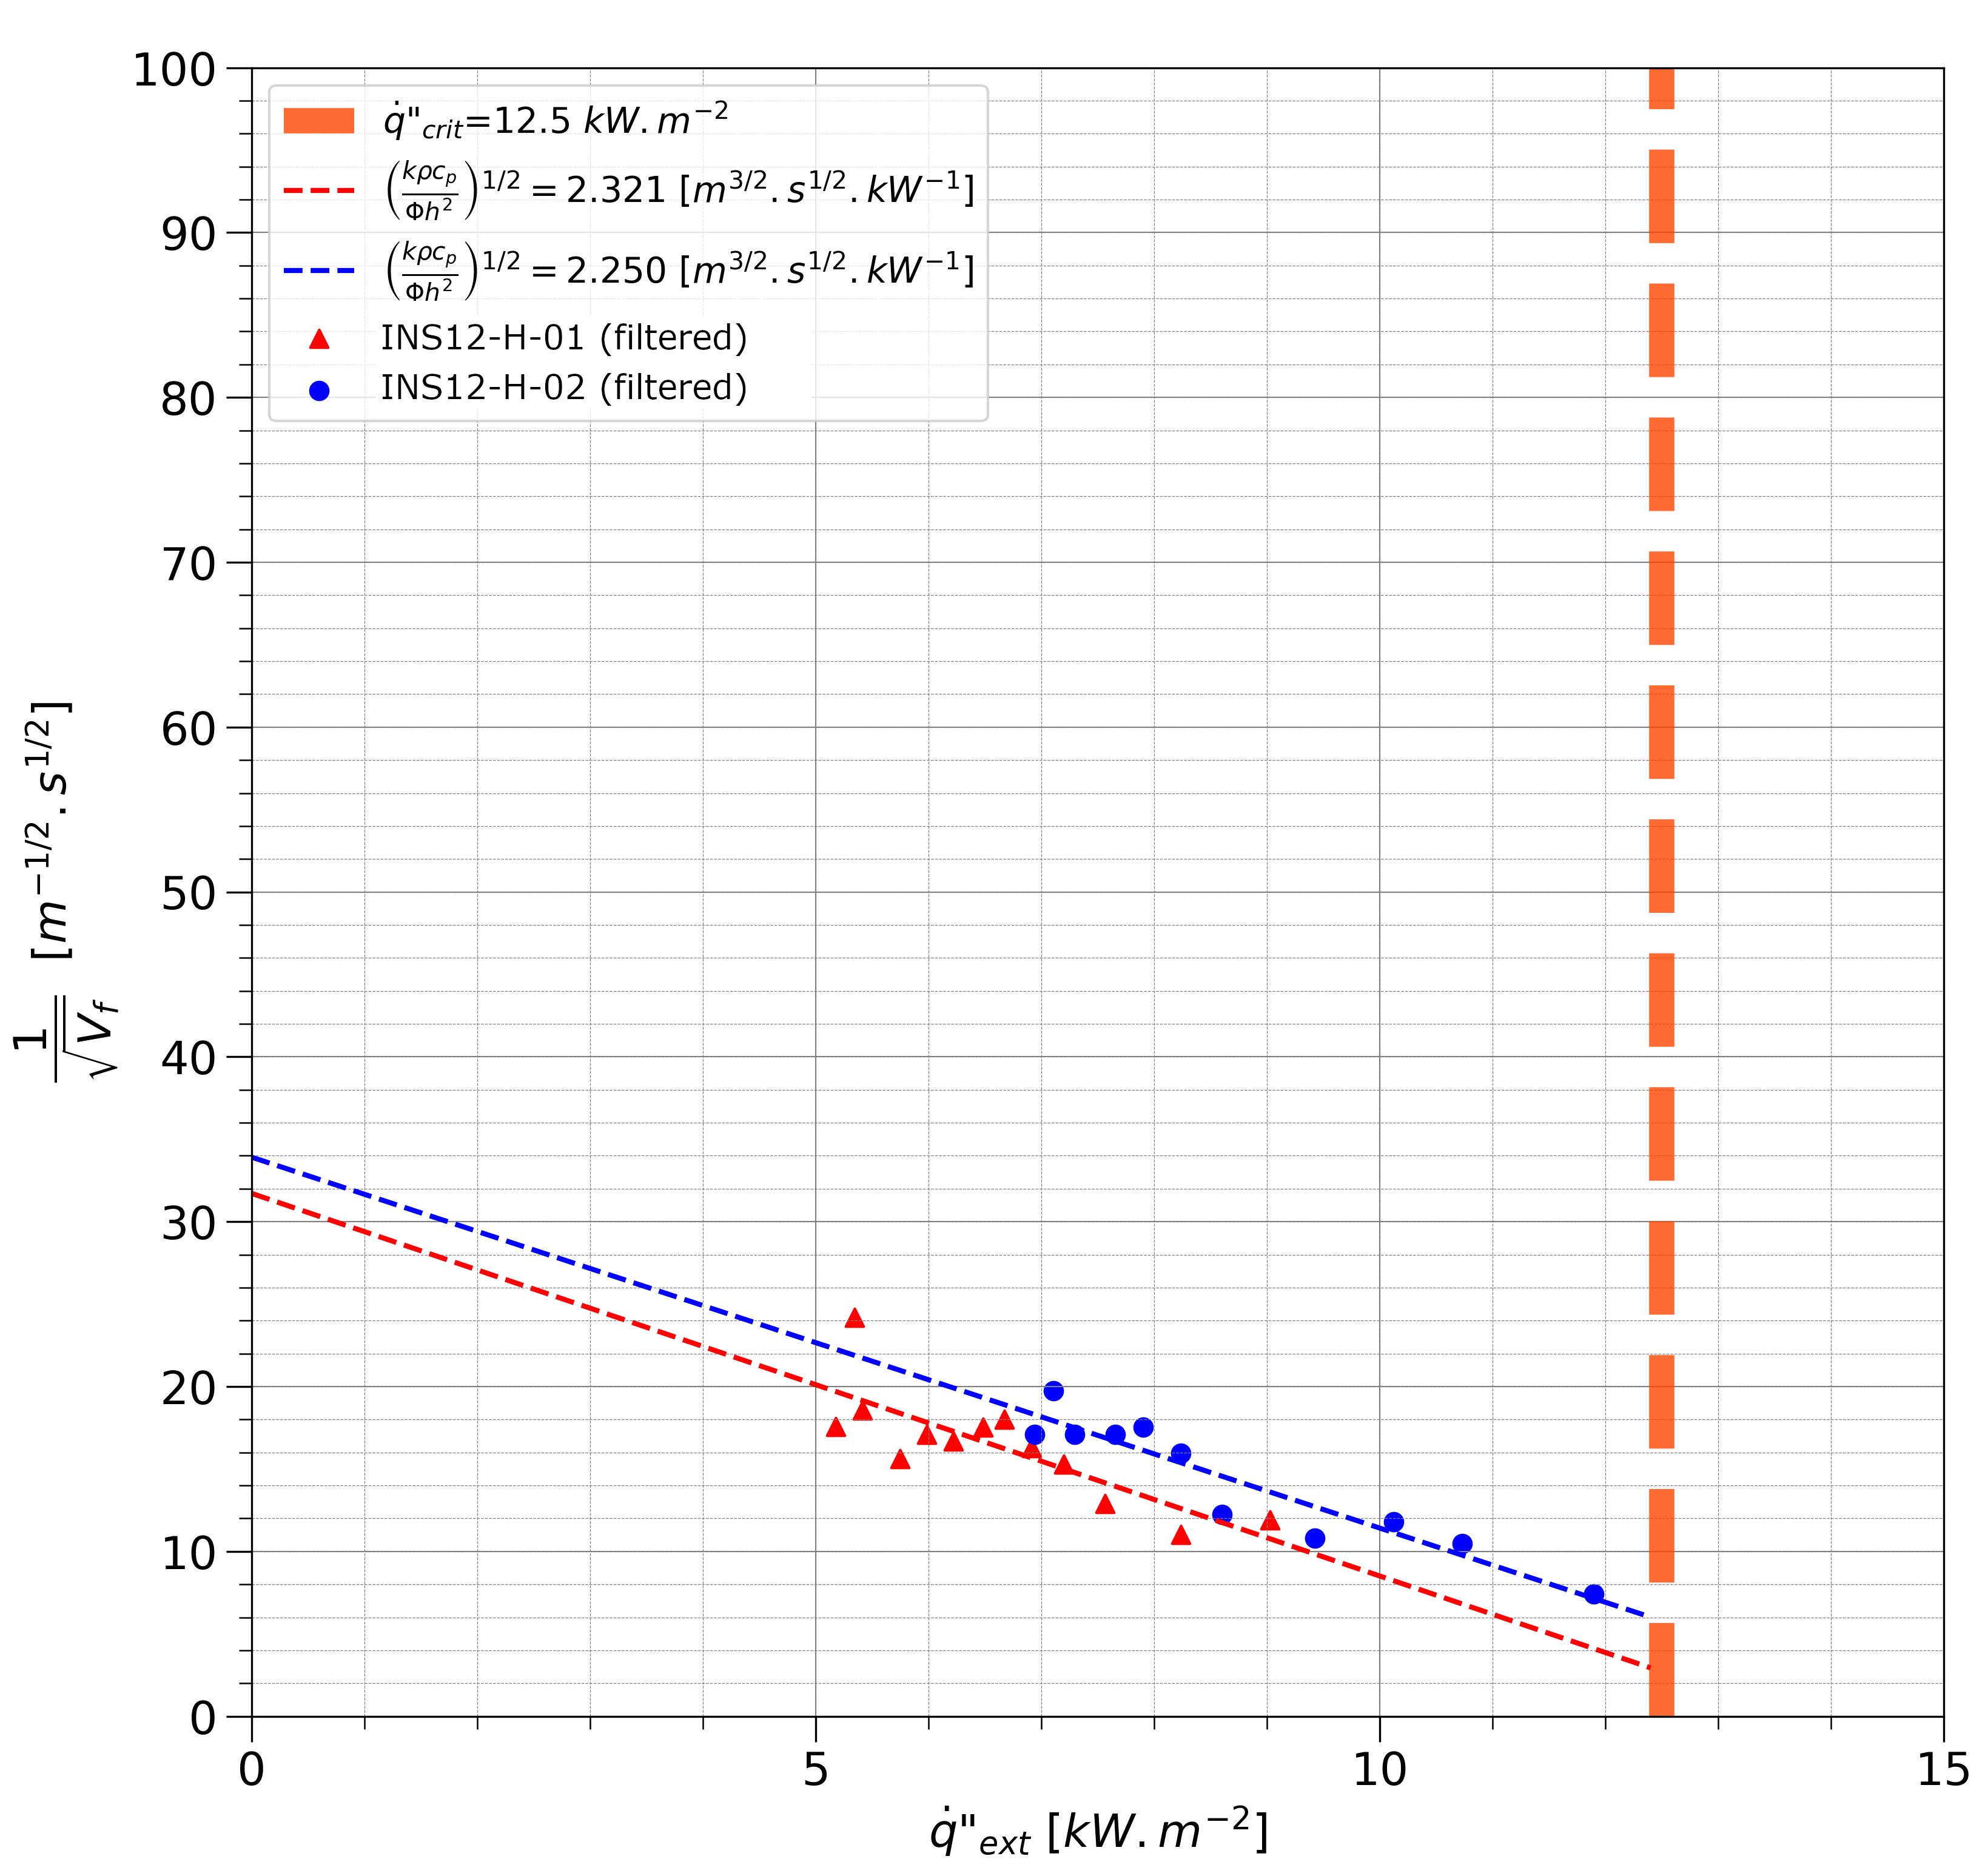
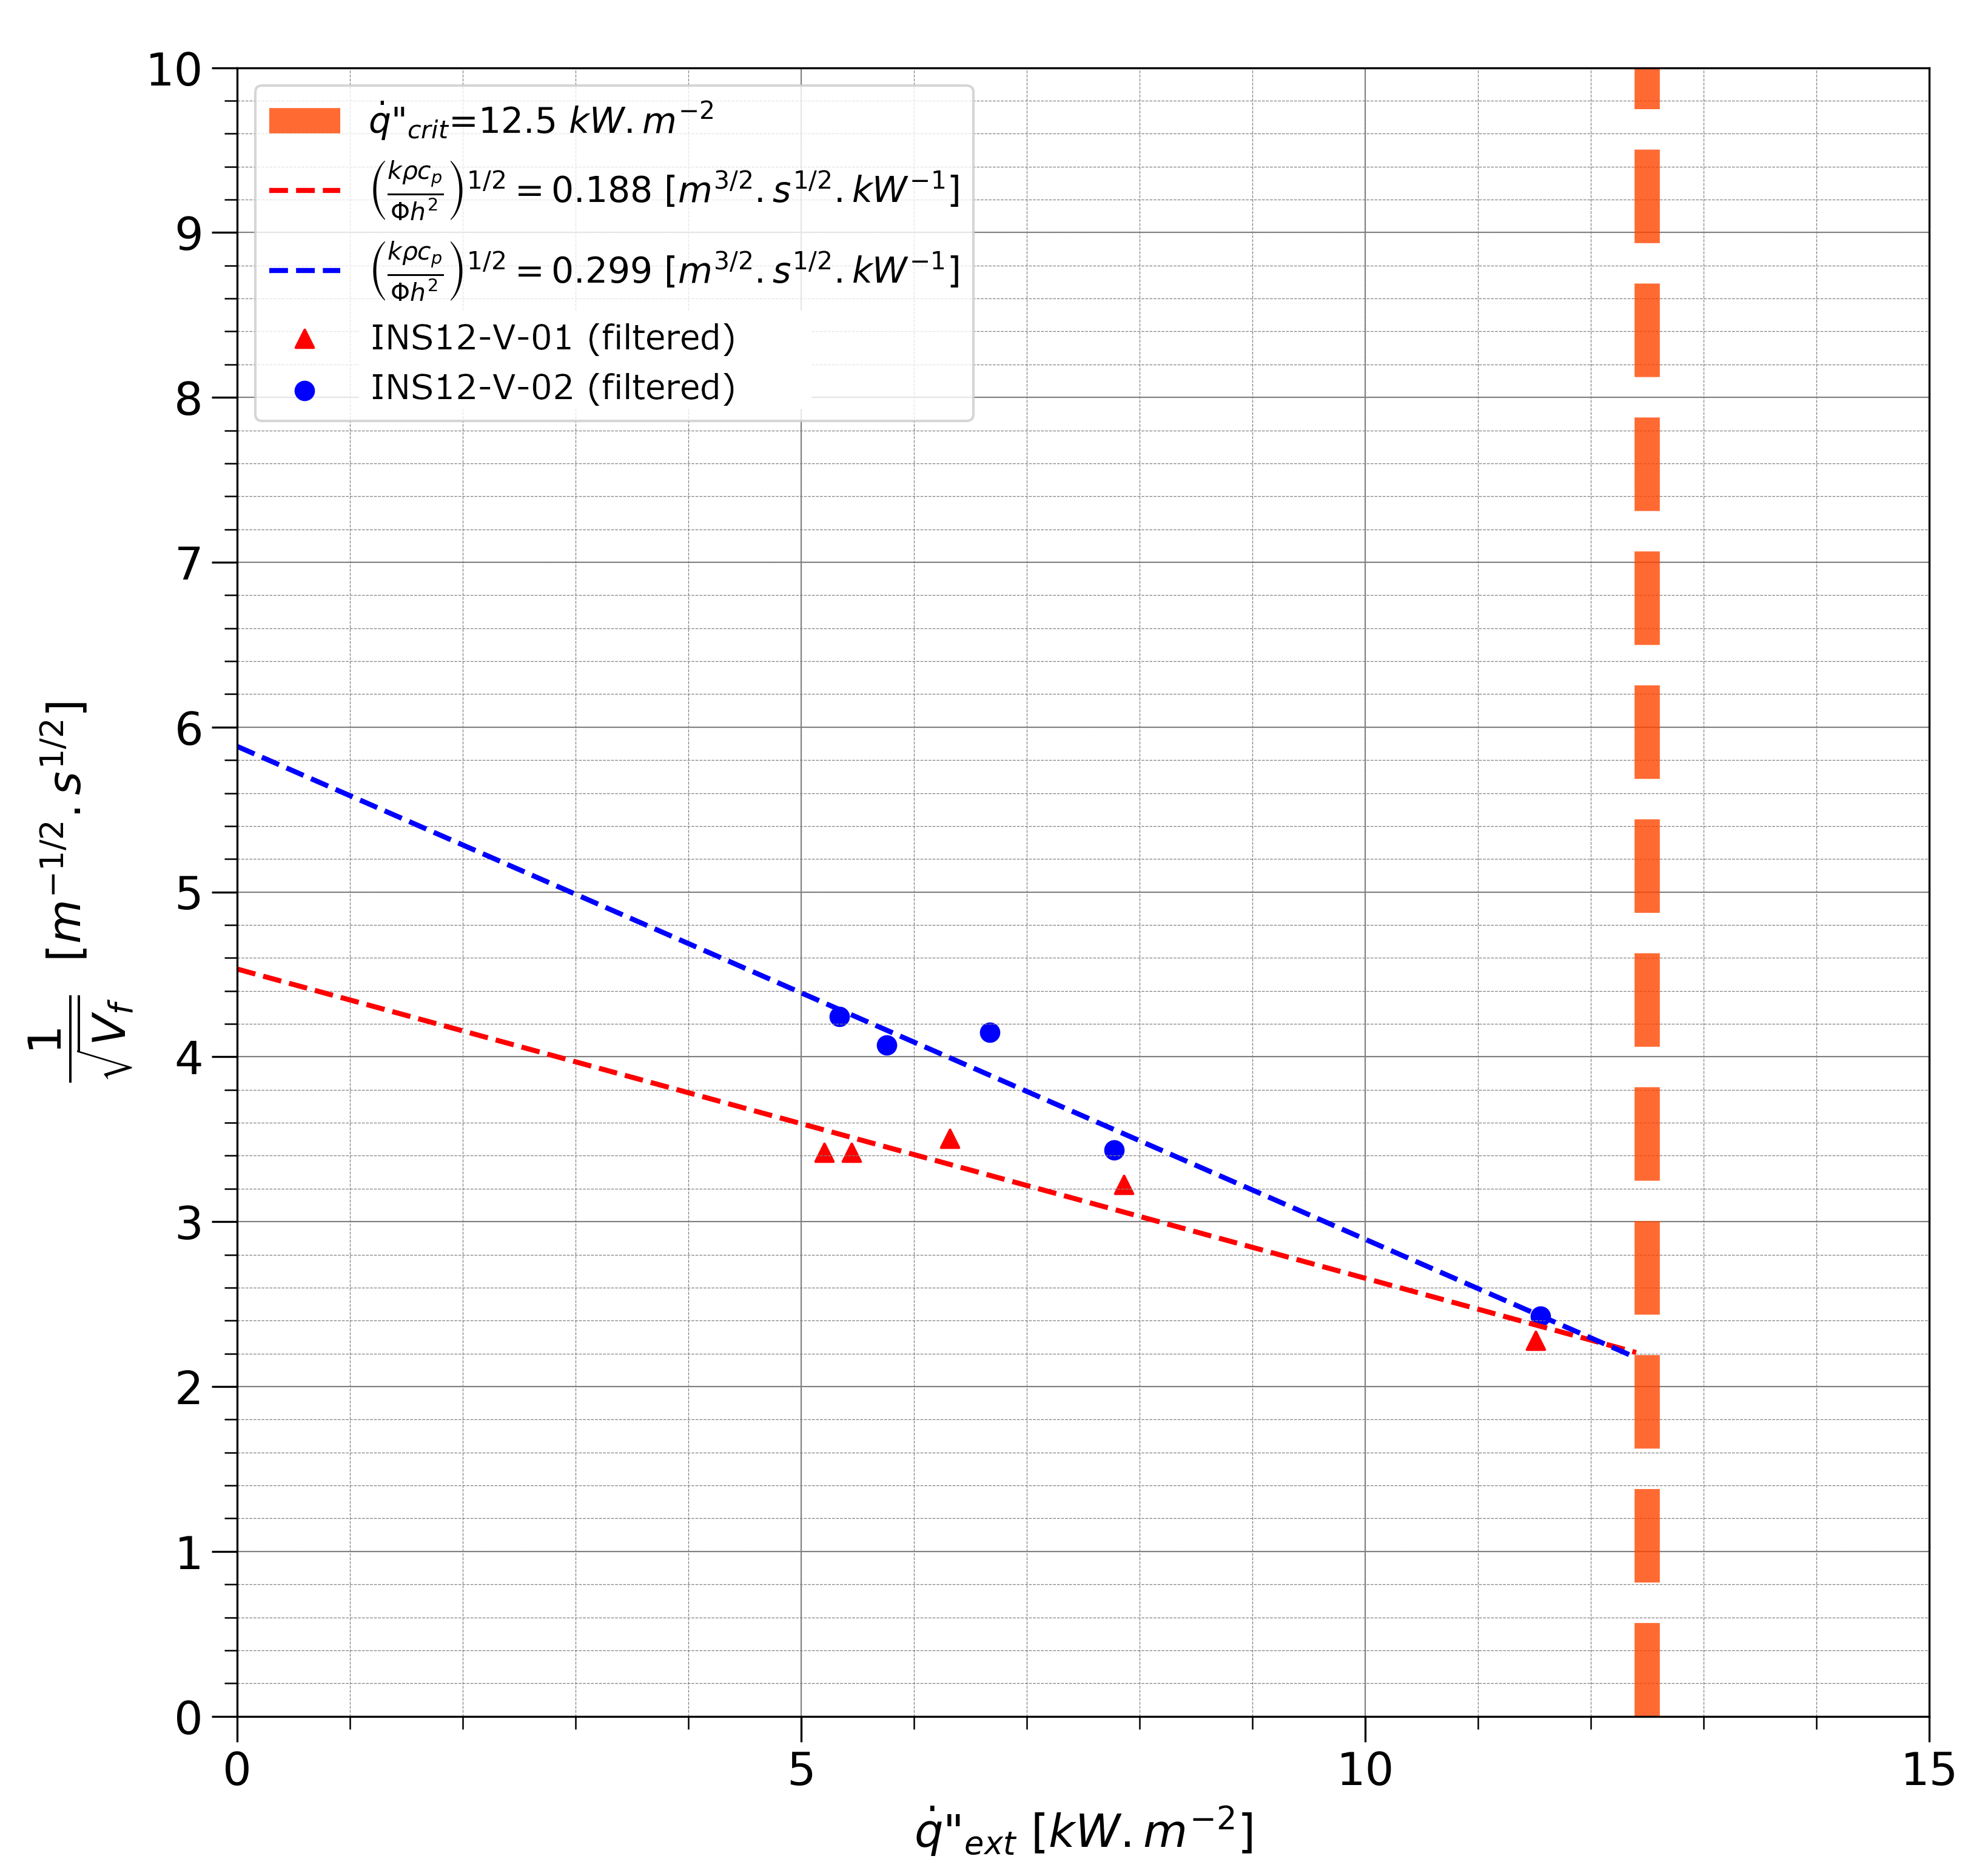
| Orientation | Trial | (kρcp⁄Φh2)1⁄2 [m3⁄2 s1⁄2 kW-1] | Φ [kW2 m-3] |
|---|---|---|---|
| Horizontal | 1 | 2.321 | 12.31 |
| Horizontal | 2 | 2.25 | 13.10 |
| Vertical | 1 | 0.188 | 1000 |
| Vertical | 2 | 0.299 | 1000 |