INS05
Material description
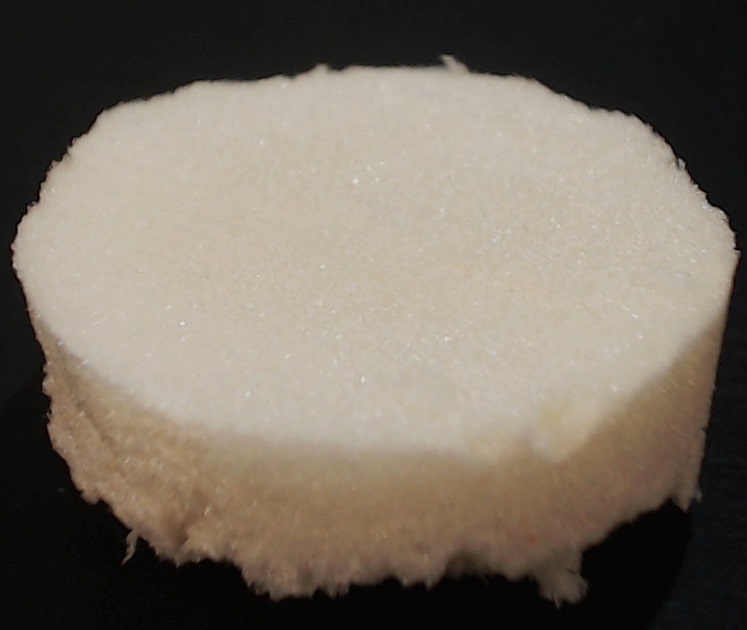
Material ID: INS05
Material type: Isocyanurate-based polyurethane foam (PIR)
Polymer: Isocyanurate-based polyurethane (92%)
Additives (fire retardants, fillers or traces of inorganic elements): Chlorine (4%), Phosphorus (3%), Potassium (1%), traces of other elements (<1%)
Core thickness: 72.38mm
| Compound | Mass Concentration (%) |
|---|---|
| Isocyanurate-based polyurethane (PIR) | 92 |
| Chlorine (Cl) | 4 |
| Phosphorus (P) | 3 |
| Potassium (K) | 1 |
| Traces of silicon (Si) | <1 |
| Traces of sulfur (S) | <1 |
A. Material composition identification
A.1 Attenuated total reflection – Fourier transform infrared spectroscopy (ATR-FTIR)
Table 2. FTIR compound identification.| Identified Compounds |
|---|
| Isocyanurate-based polyurethane (PIR) |
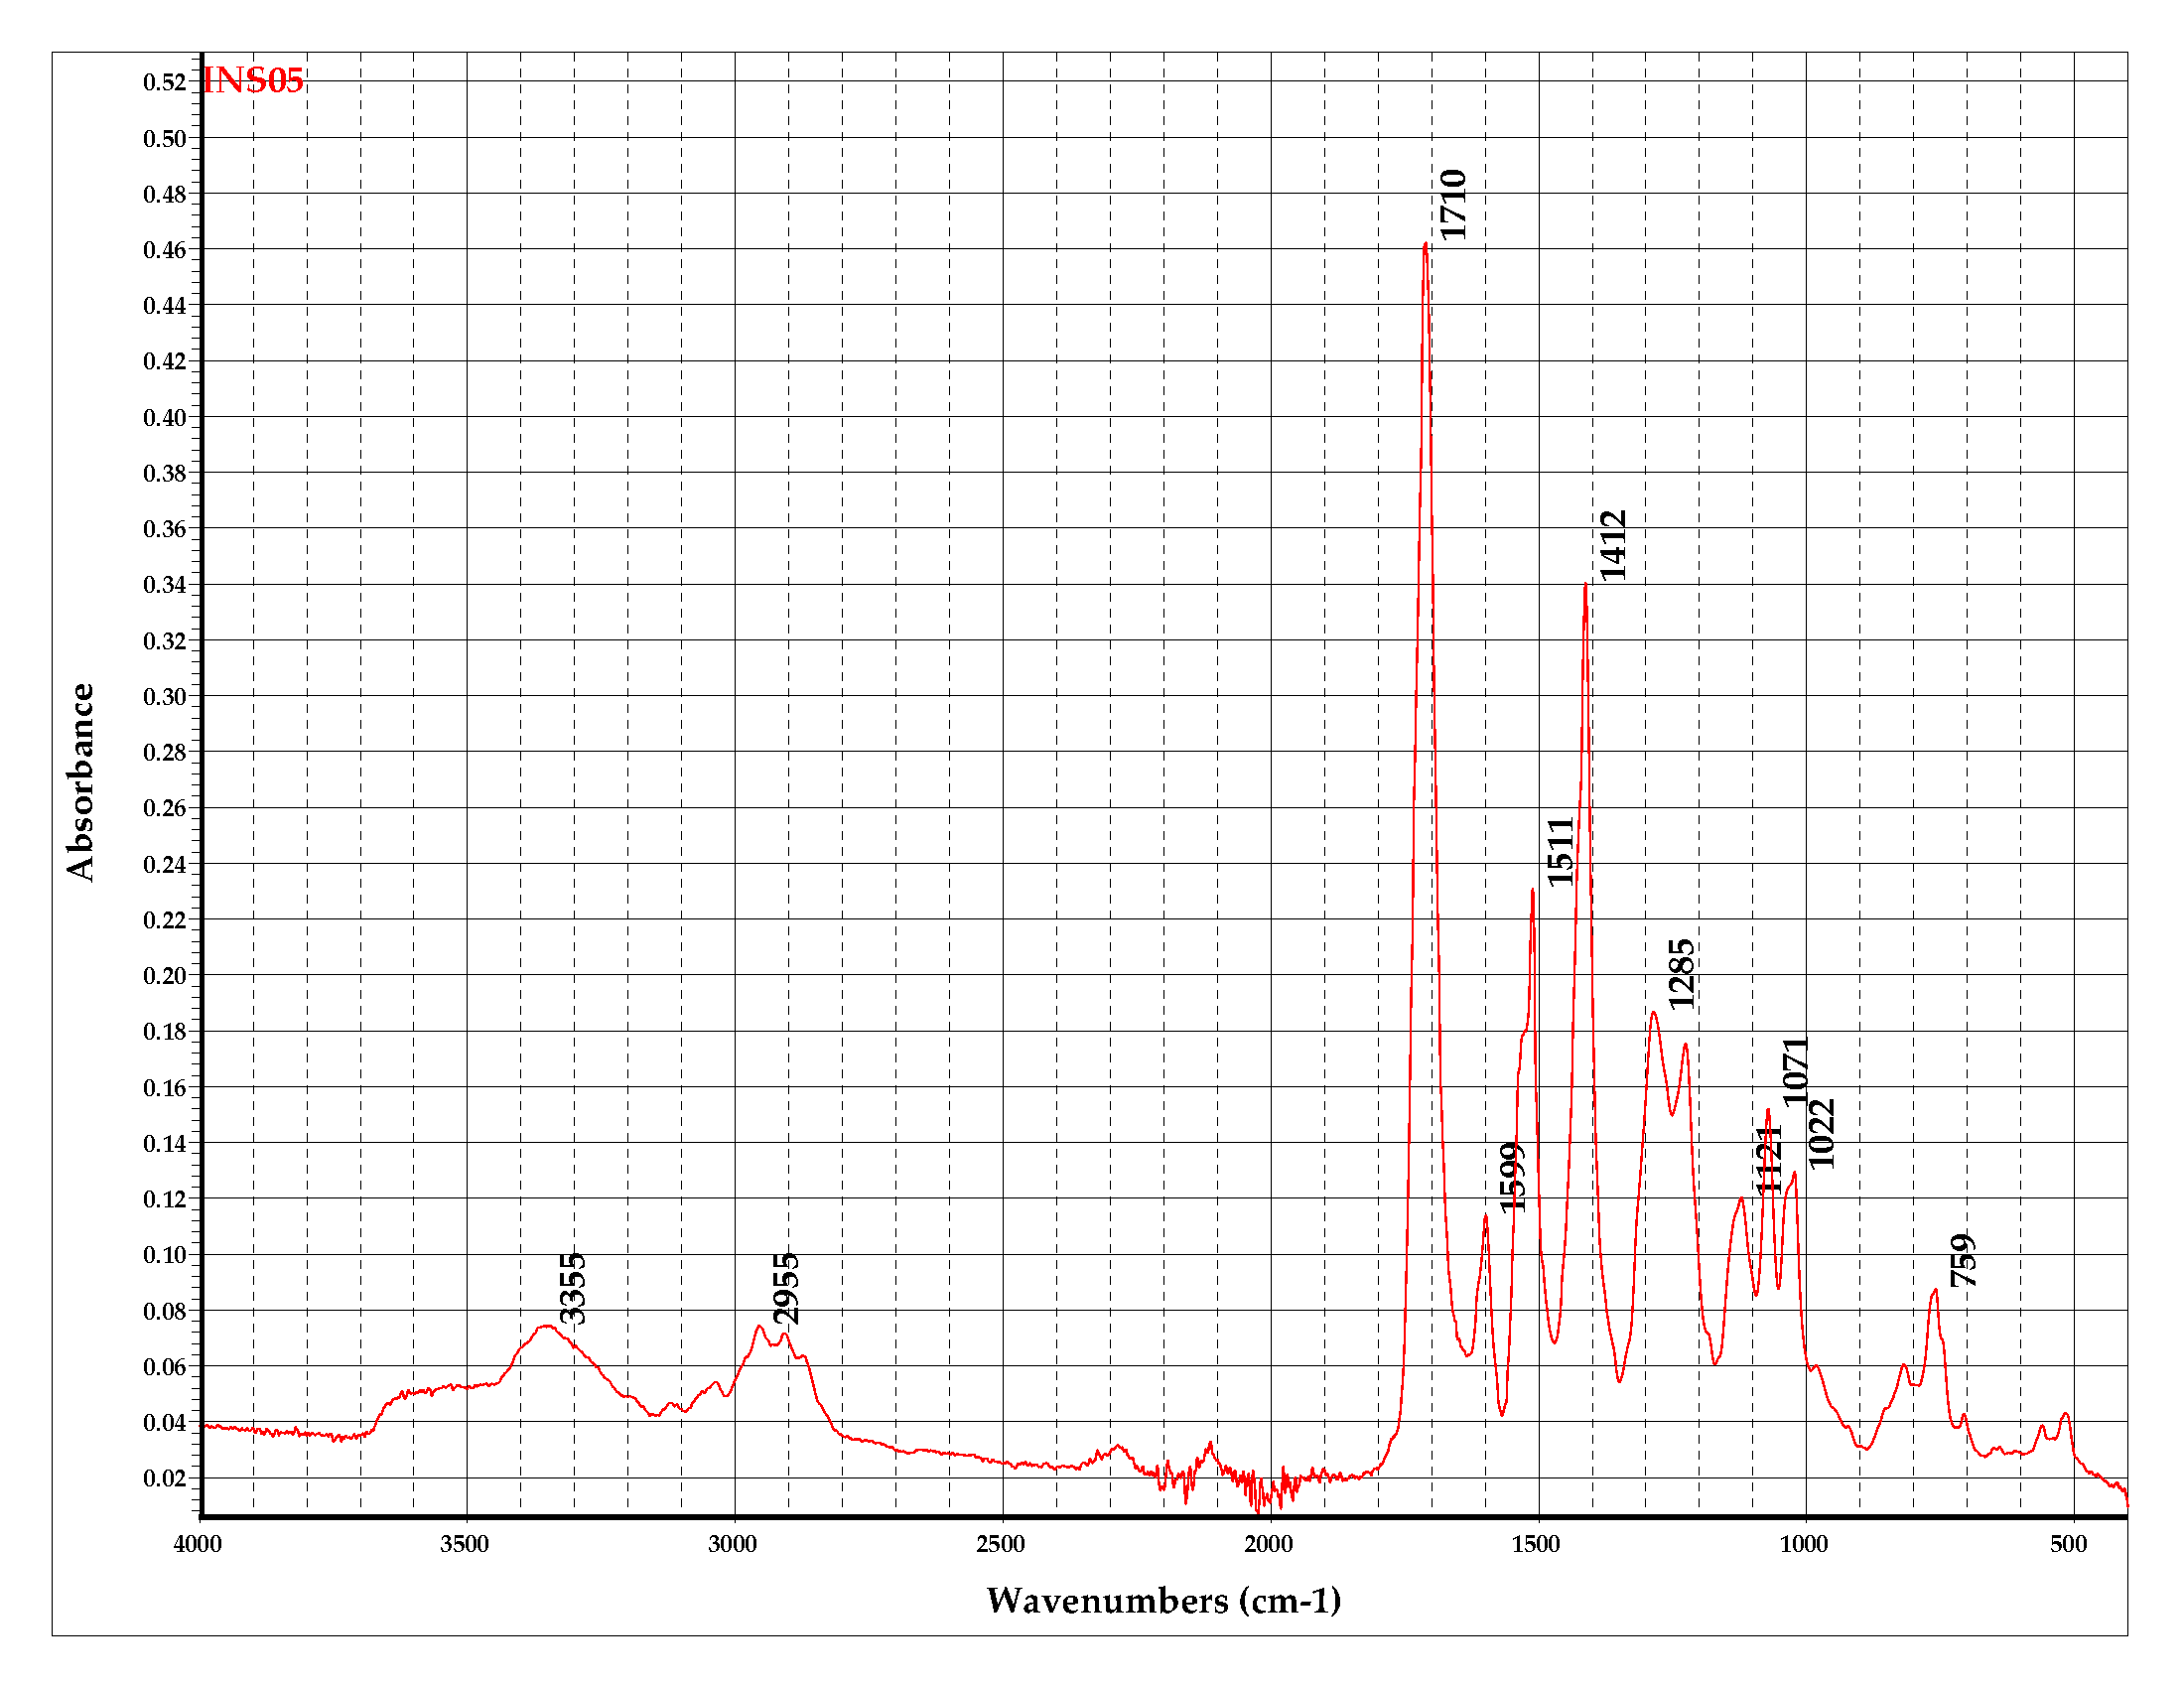
Figure 1 . FTIR spectra: Absorbance percentage versus wavenumber from the sample.
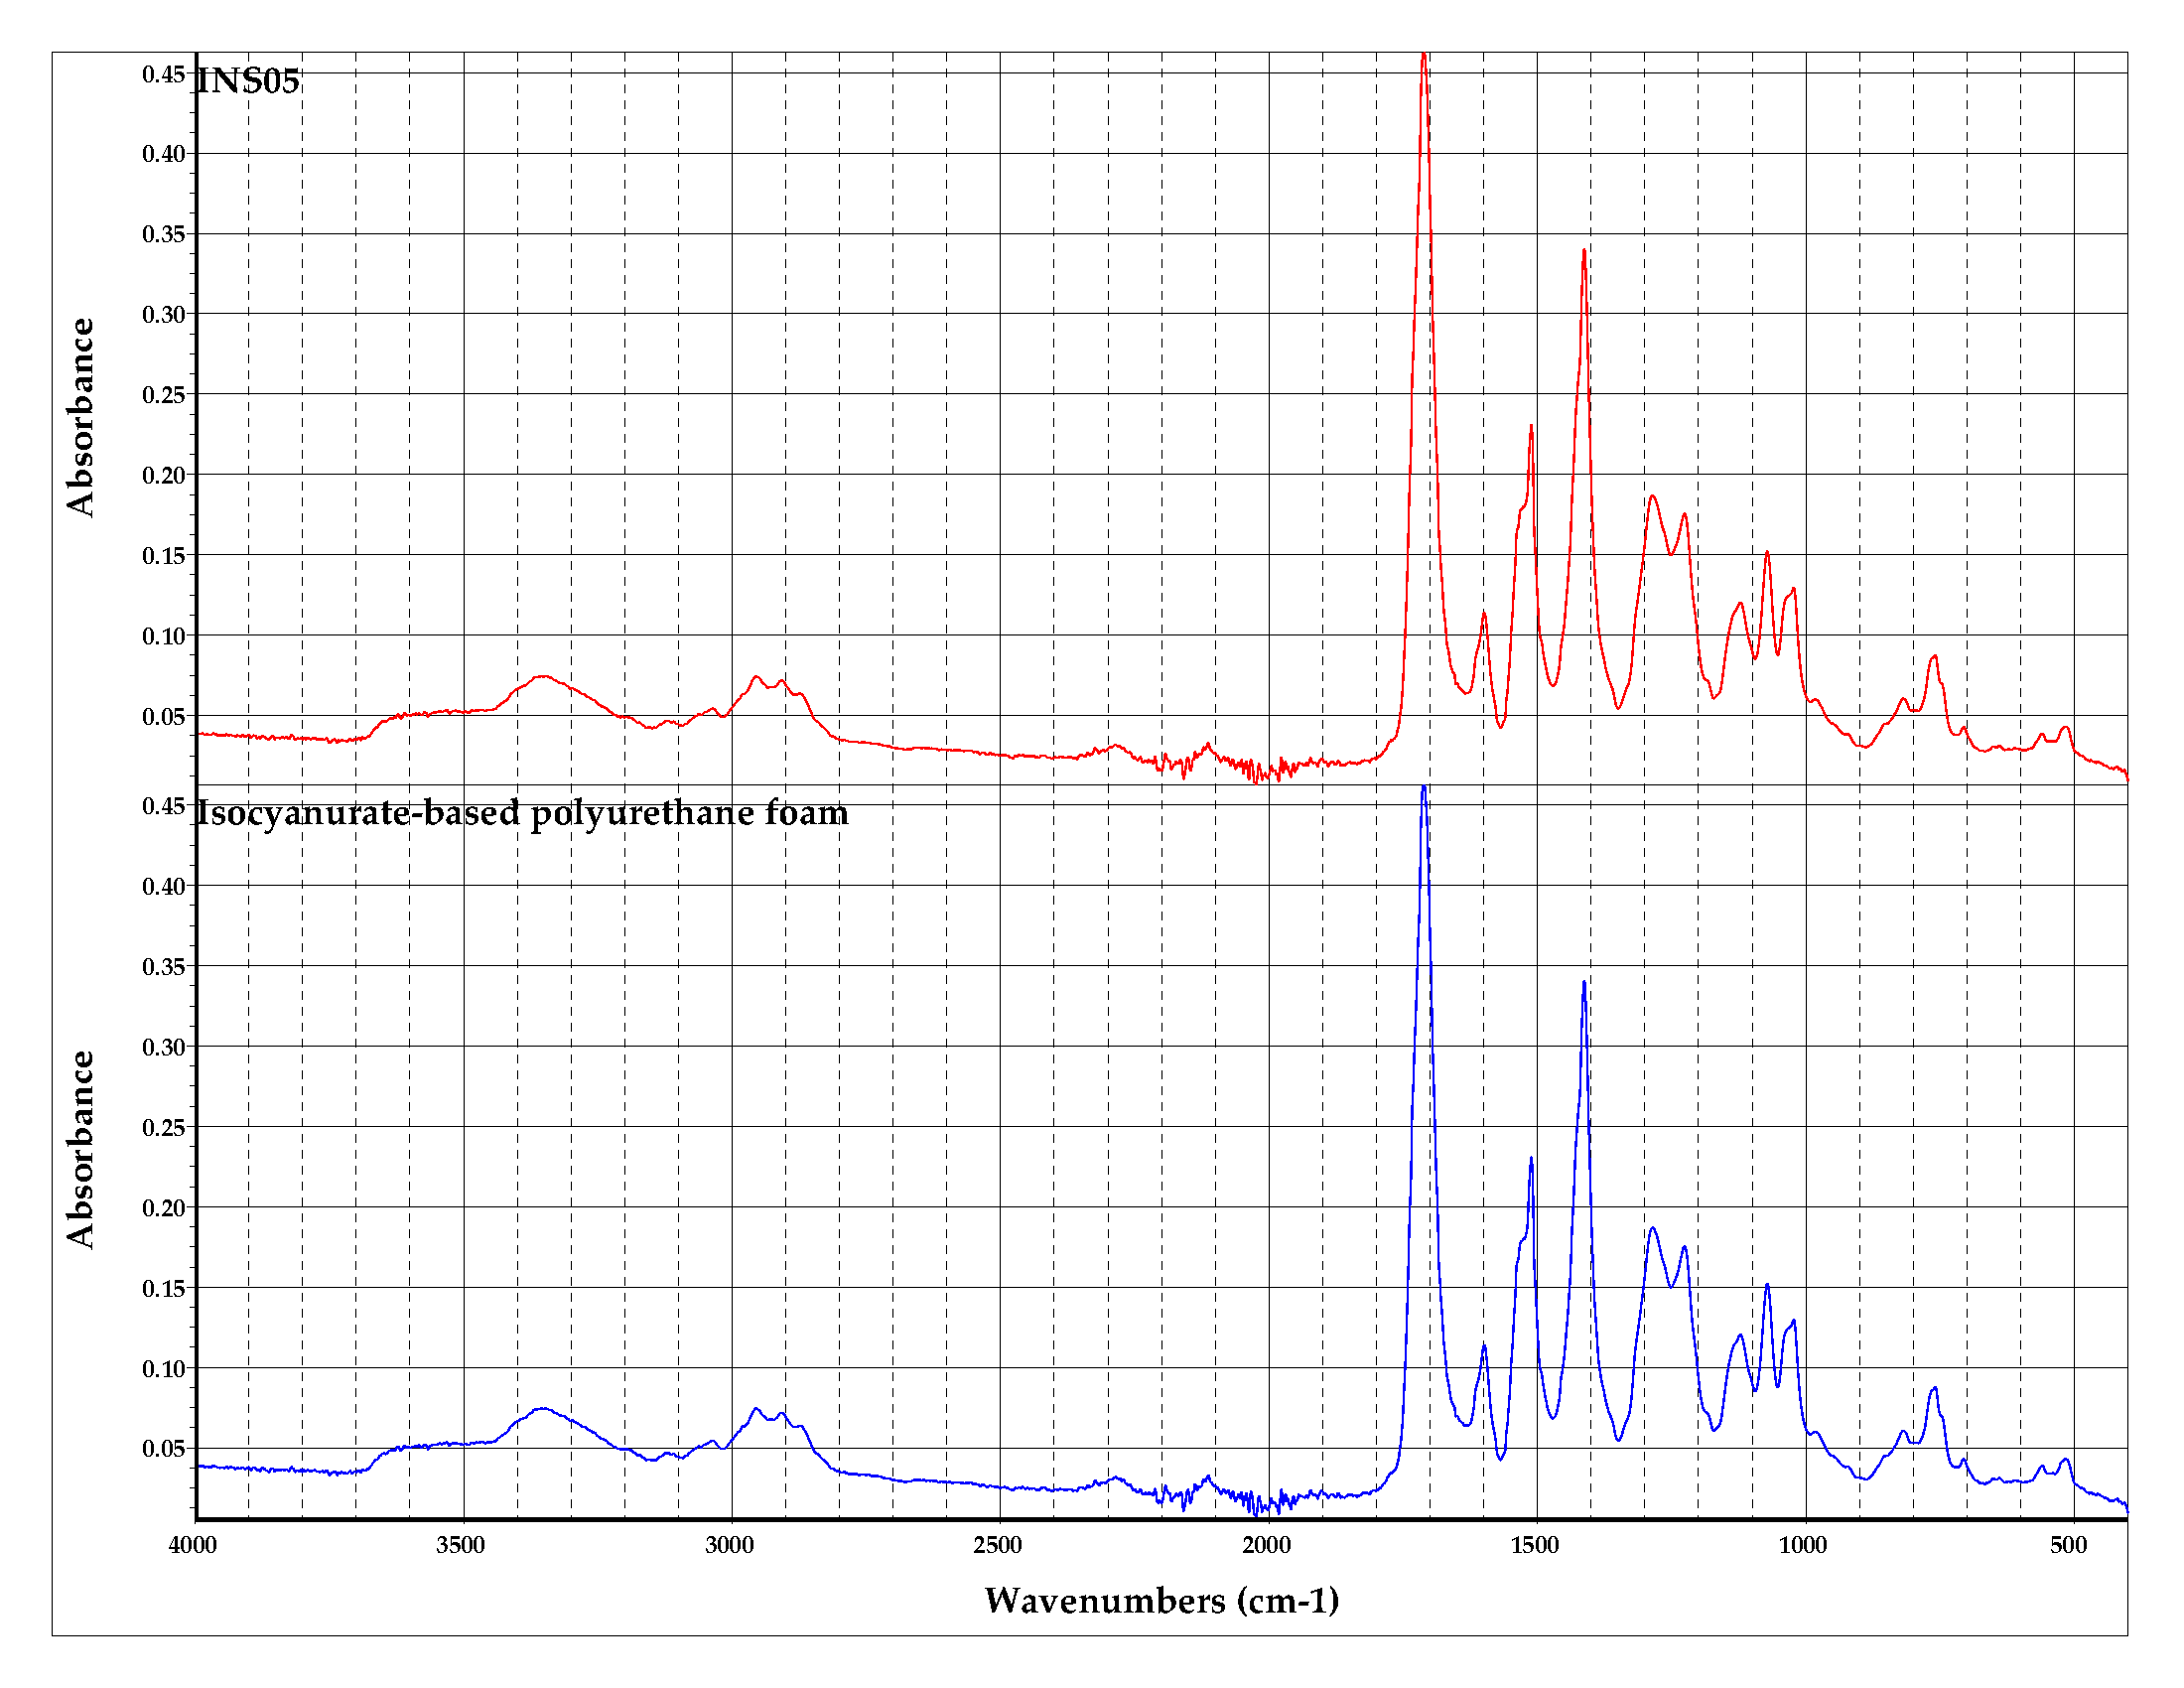
Figure 2. FTIR spectra: Absorbance percentage versus wavenumber from the sample and the identified compounds.
A.2 Energy Dispersive X-Ray Fluorescence (EDXRF)
Table 2. Inorganic elements and their mass concentration identified with EDXRF.
| Element | Mass Concentration (%) |
|---|---|
| Cl | 4 |
| P | 3 |
| K | 1 |
| Si | <1 |
| S | <1 |
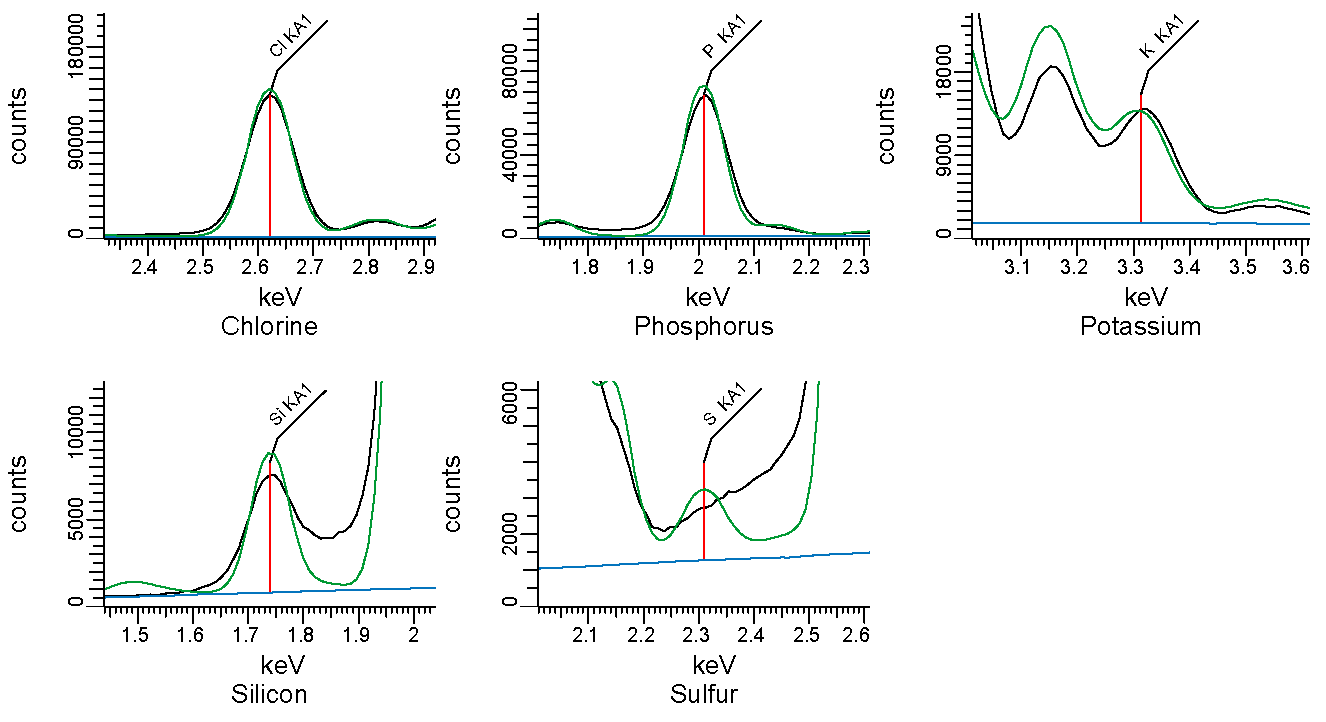
Figure 3. EDXRF spectra. Counts vs energy. Identified elements are shown as vertical lines.
B. Thermogravimetric analysis
Table 3. Mass fraction of residue after thermal decomposition.
| Condition | Fraction of mass residue at 800°C |
|---|---|
| Non-oxidative (nitrogen) | 0.26 |
| Oxidative (air) | 0 |
Table 4. Temperature and amplitude of main peaks in non-oxidative conditions.
| Peak ID | Temperature peak (°C) | Amplitude of peak (°C-1) |
|---|---|---|
| Peak 1 | 159 | 1.22 x 10⁻³ |
| Peak 2 | 298 | 6.49 x 10⁻³ |
| Peak 3 | 305 | 5.07 x 10⁻³ |
| Peak 4 | 309 | 6.4 x 10⁻³ |
| Peak 5 | 362 | 2.4 x 10⁻³ |
Table 5. Temperature and amplitude of main peaks in oxidative conditions.
| Peak ID | Temperature peak (°C) | Amplitude of peak (°C-1) |
|---|---|---|
| Peak 1 | 165 | 1.16 x 10⁻³ |
| Peak 2 | 326 | 6.18 x 10⁻³ |
| Peak 3 | 566 | 7.32 x 10⁻³ |
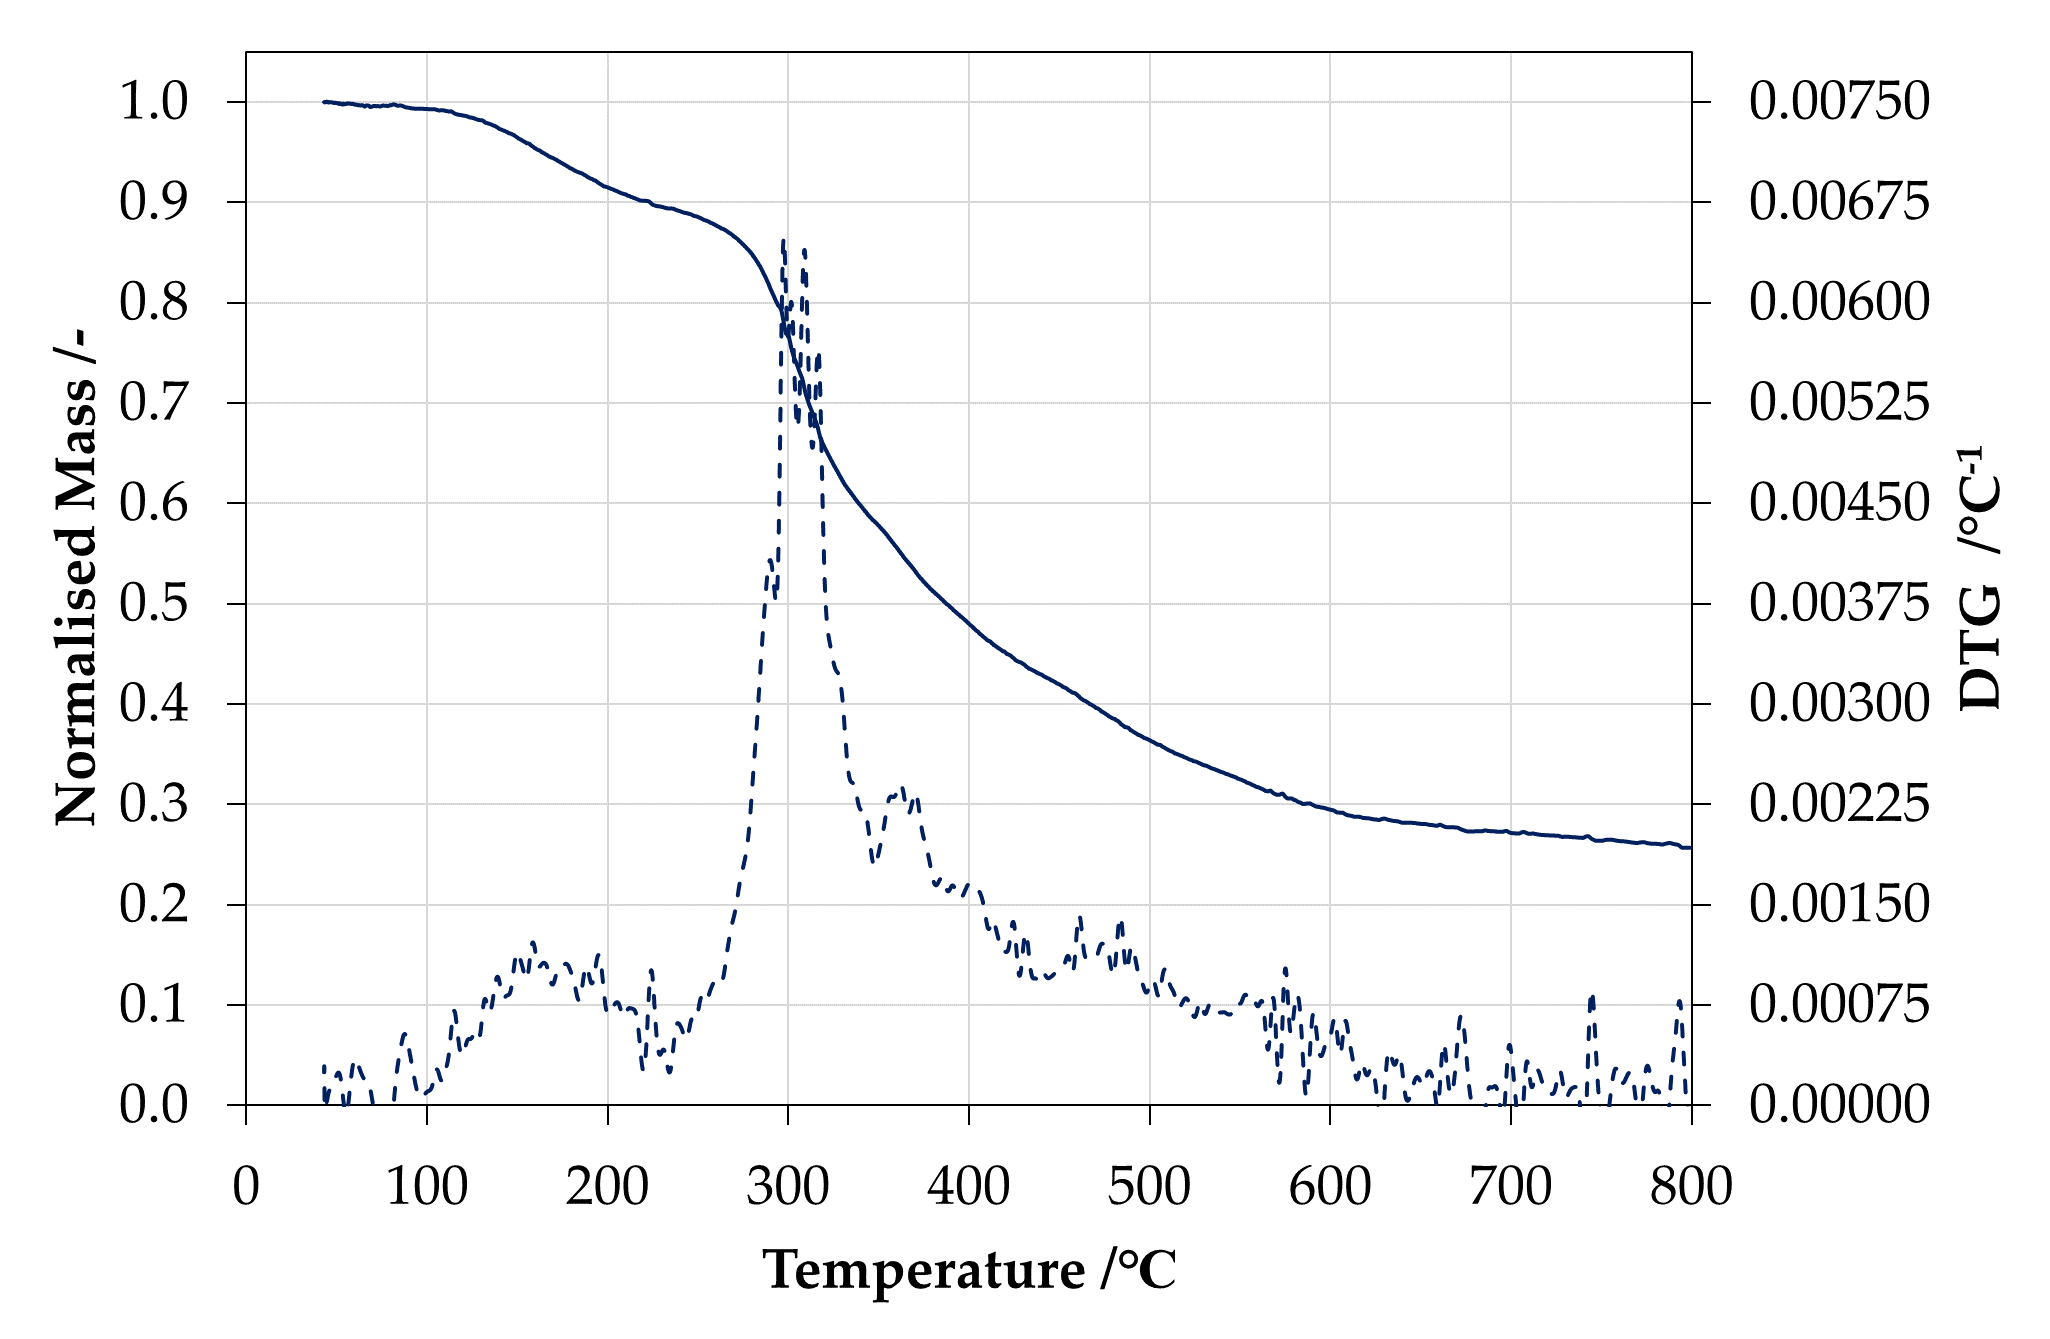
Figure 4. Normalised mass (solid line) and derivative of the normalised mass (dashed line) in 150 ml min-1 of nitrogen and a heating rate of 20°C min-1.
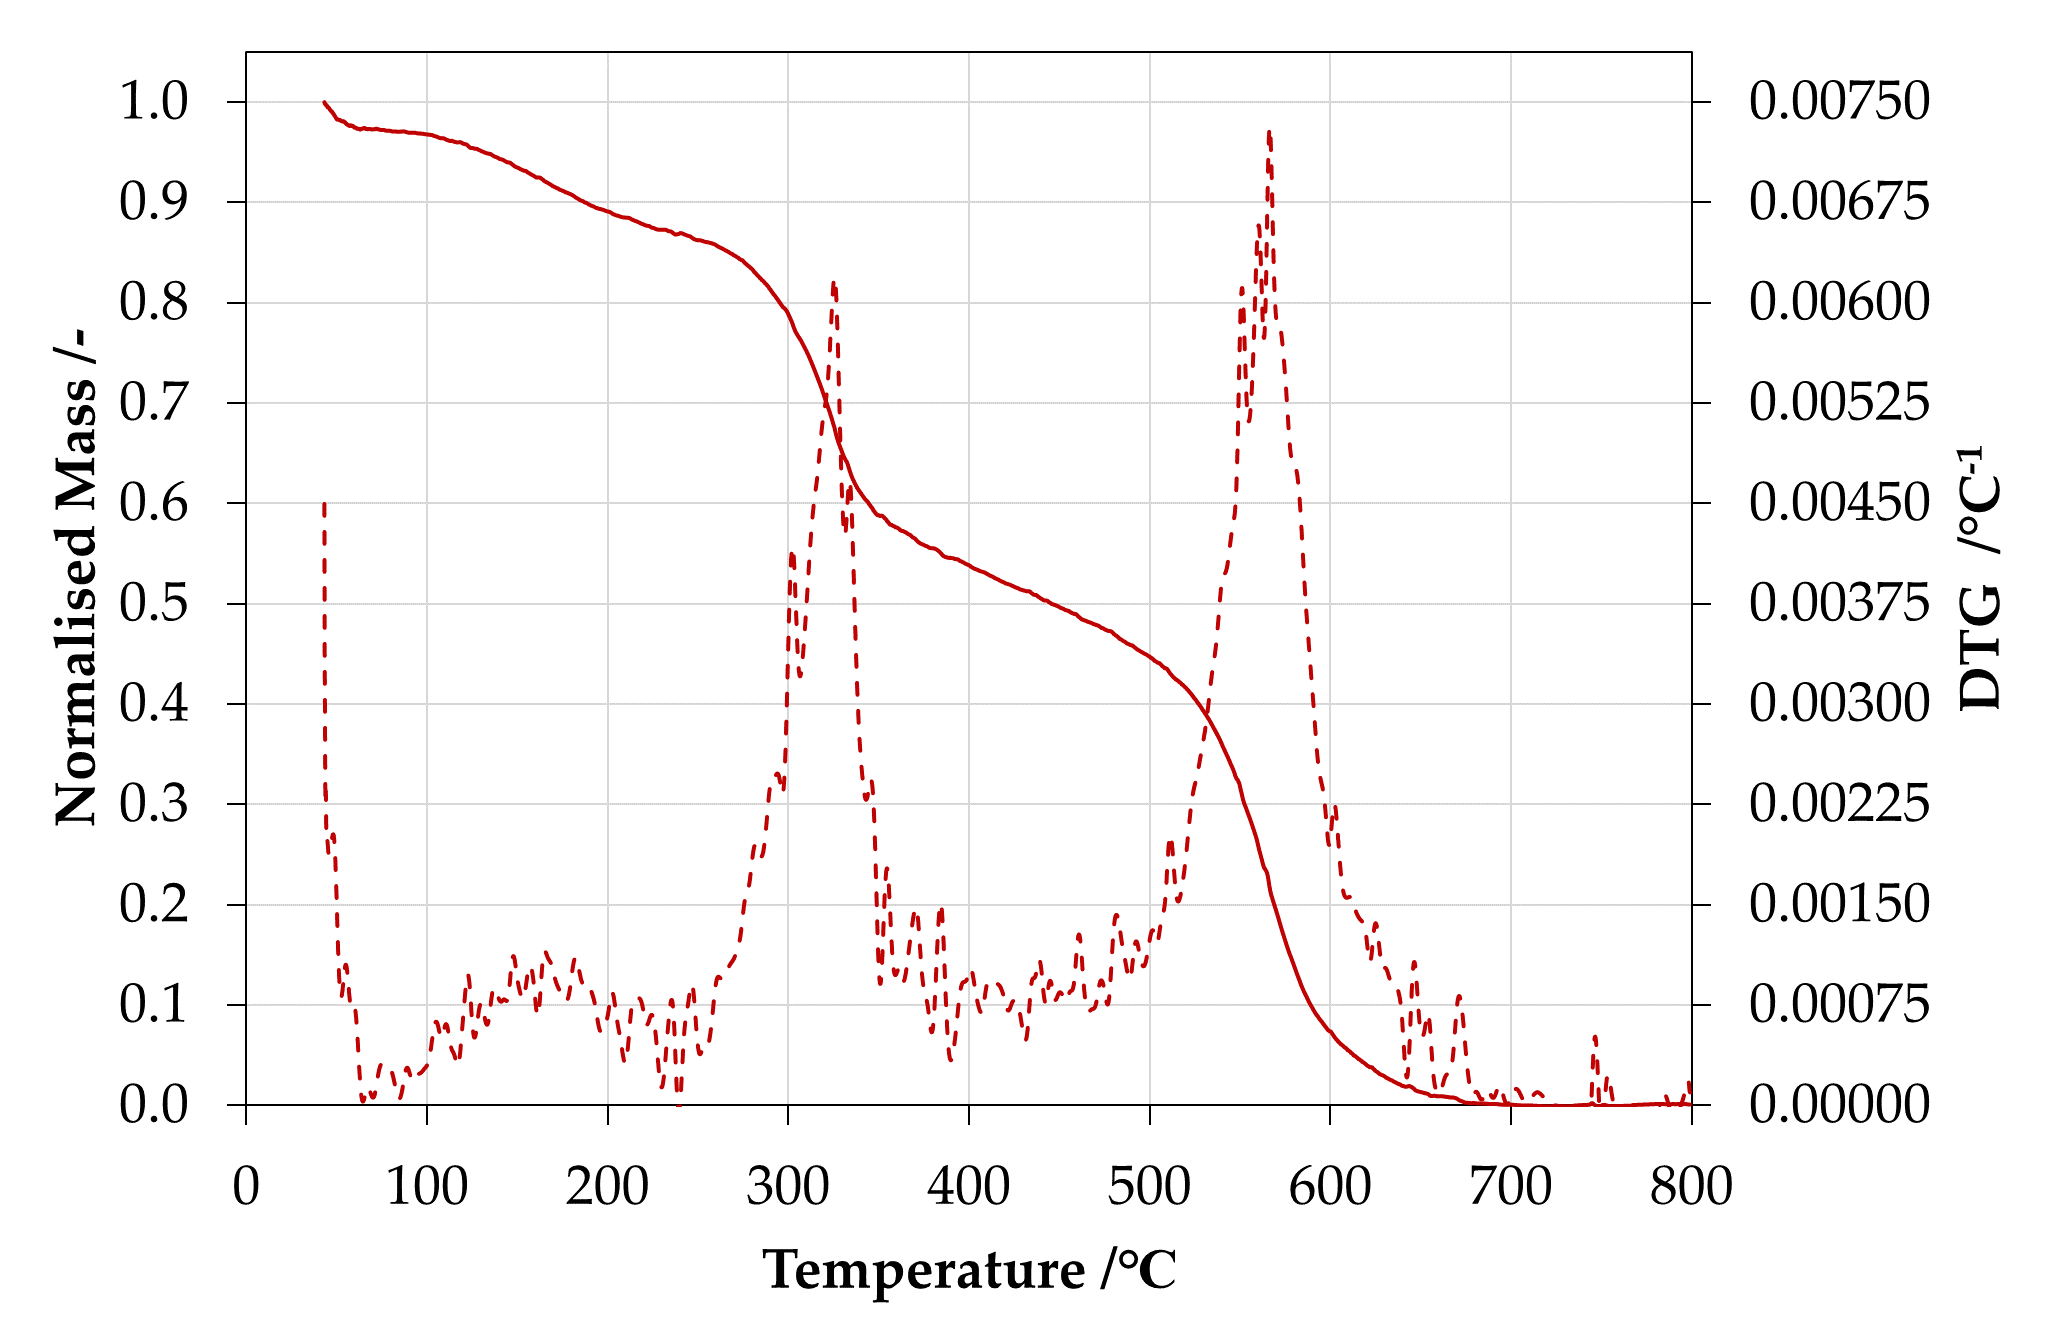
Figure 5. Normalised mass (solid line) and derivative of the normalised mass (dashed line) in 150 ml min-1 of air and a heating rate of 20°C min-1 .
C. Gross Heat of Combustion
Table 7. Gross Heat of Combustion individual results for sample.| Trial | ΔHc [kJ g-1] |
|---|---|
| Trial 1 | 28.74 |
| Trial 2 | 27.93 |
| Trial 3 | 28.30 |
| Average | 28.32 |
| Std dev | 0.41 |
D. Ignition parameters
Table 8. Summary of ignition parameters for sample.| Critical heat flux for ignition | Ignition temperature | Total heat transfer coefficient of losses | Apparent thermal inertia |
|---|---|---|---|
| q̇″cr [kW m−2] | Tig [°C] | hr [W m-2 K-1] | kρc [kW2 m-4 K-2 s] |
| 11.80 | 326 | 34.70 | 0.144 |
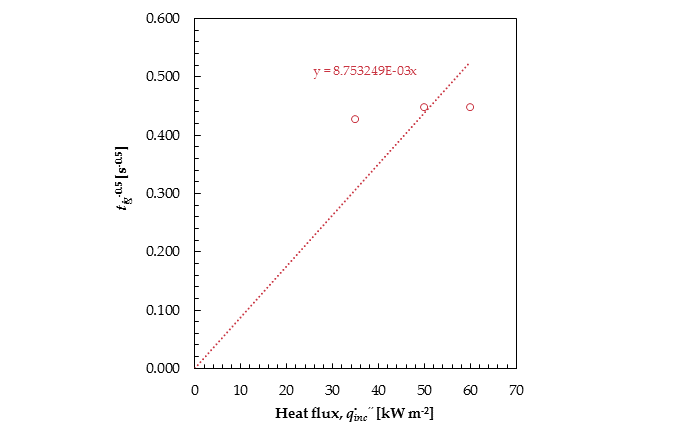
Figure 6. Time-to-ignition vs incident radiant heat flux for samples.
E. Burning behaviour
Table 9. Summary of key burning behaviour metrics.
| Heat flux | Test | Time to ignition | Fraction of mass residue | Peak heat release rate | Total energy released |
|---|---|---|---|---|---|
| q̇″inc [kW m-2] | tig [s] | mres [-] | q̇″p [kW m-2] | Qt [MJ m-2] | |
| 35 kW m-2 | |||||
| Test 1 | 6 | 0.85 | 226.91 | 16.59 | |
| Test 2 | 5 | 0.83 | 218.69 | 13.37 | |
| Avg | 6 | 0.84 | 222.80 | 14.98 | |
| 50 kW m-2 | |||||
| Test 1 | 4 | 0.77 | 249.47 | 31.16 | |
| Test 2 | 6 | 0.78 | 284.37 | 28.46 | |
| Avg | 5 | 0.78 | 266.92 | 29.81 | |
| 60 kW m-2 | |||||
| Test 1 | 6 | 0.81 | 301.09 | 21.21 | |
| Test 2 | 4 | 0.82 | 316.87 | 24.08 | |
| Avg | 5 | 0.81 | 188.03 | 22.65 | |
| 80 kW m-2 | |||||
| Test 1 | - | - | - | - | |
| Test 2 | - | - | - | - | |
| Avg | - | - | - | - |
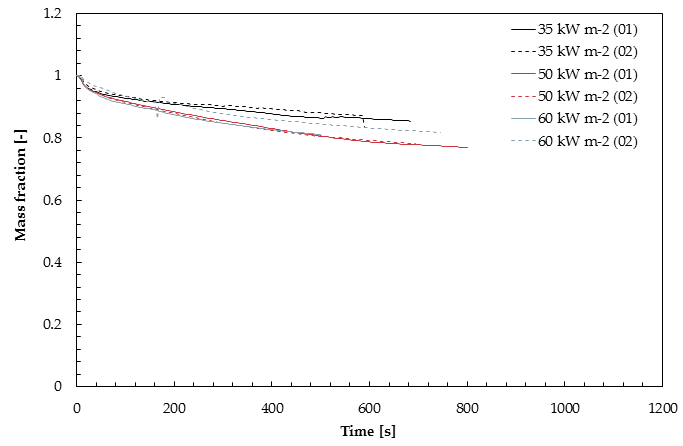
Figure 7. Normalised mass loss over time for samples tested with 35, 50, 60 and 80 kW m-2.

Figure 8. Heat release rate per unit area over time for samples tested with 35, 50, 60 and 80 kW m-2.
Table 10. Effective Heat of Combustion individual results for sample.
| Test | ΔHc [kJ g-1] |
|---|---|
| 35 kW m-2 (Test 1) | 17.42 |
| 35 kW m-2 (Test 2) | 12.22 |
| 50 kW m-2 (Test 1) | 20.49 |
| 50 kW m-2 (Test 2) | 20.01 |
| 60 kW m-2 (Test 1) | 17.25 |
| 60 kW m-2 (Test 2) | 20.17 |
| 80 kW m-2 (Test 1) | - |
| 80 kW m-2 (Test 2) | - |
| Average | 17.93 |
| Std dev | 3.14 |
Additional information:
Update 2020/02/04: Error in the extraction of the peak heat release rate for 60 kW m-2 (1) was fixed.
F. Flame Spread
Table 11. Minimum heat flux for flame spread rate and minimum flame spread rate for sample.
| Orientation | q̇″min.spread [kW m-2] | Vf.min [mm s-1] |
|---|---|---|
| Horizontal | 6.30 | 1.50 |
| Vertical | 6.50 | 22 |
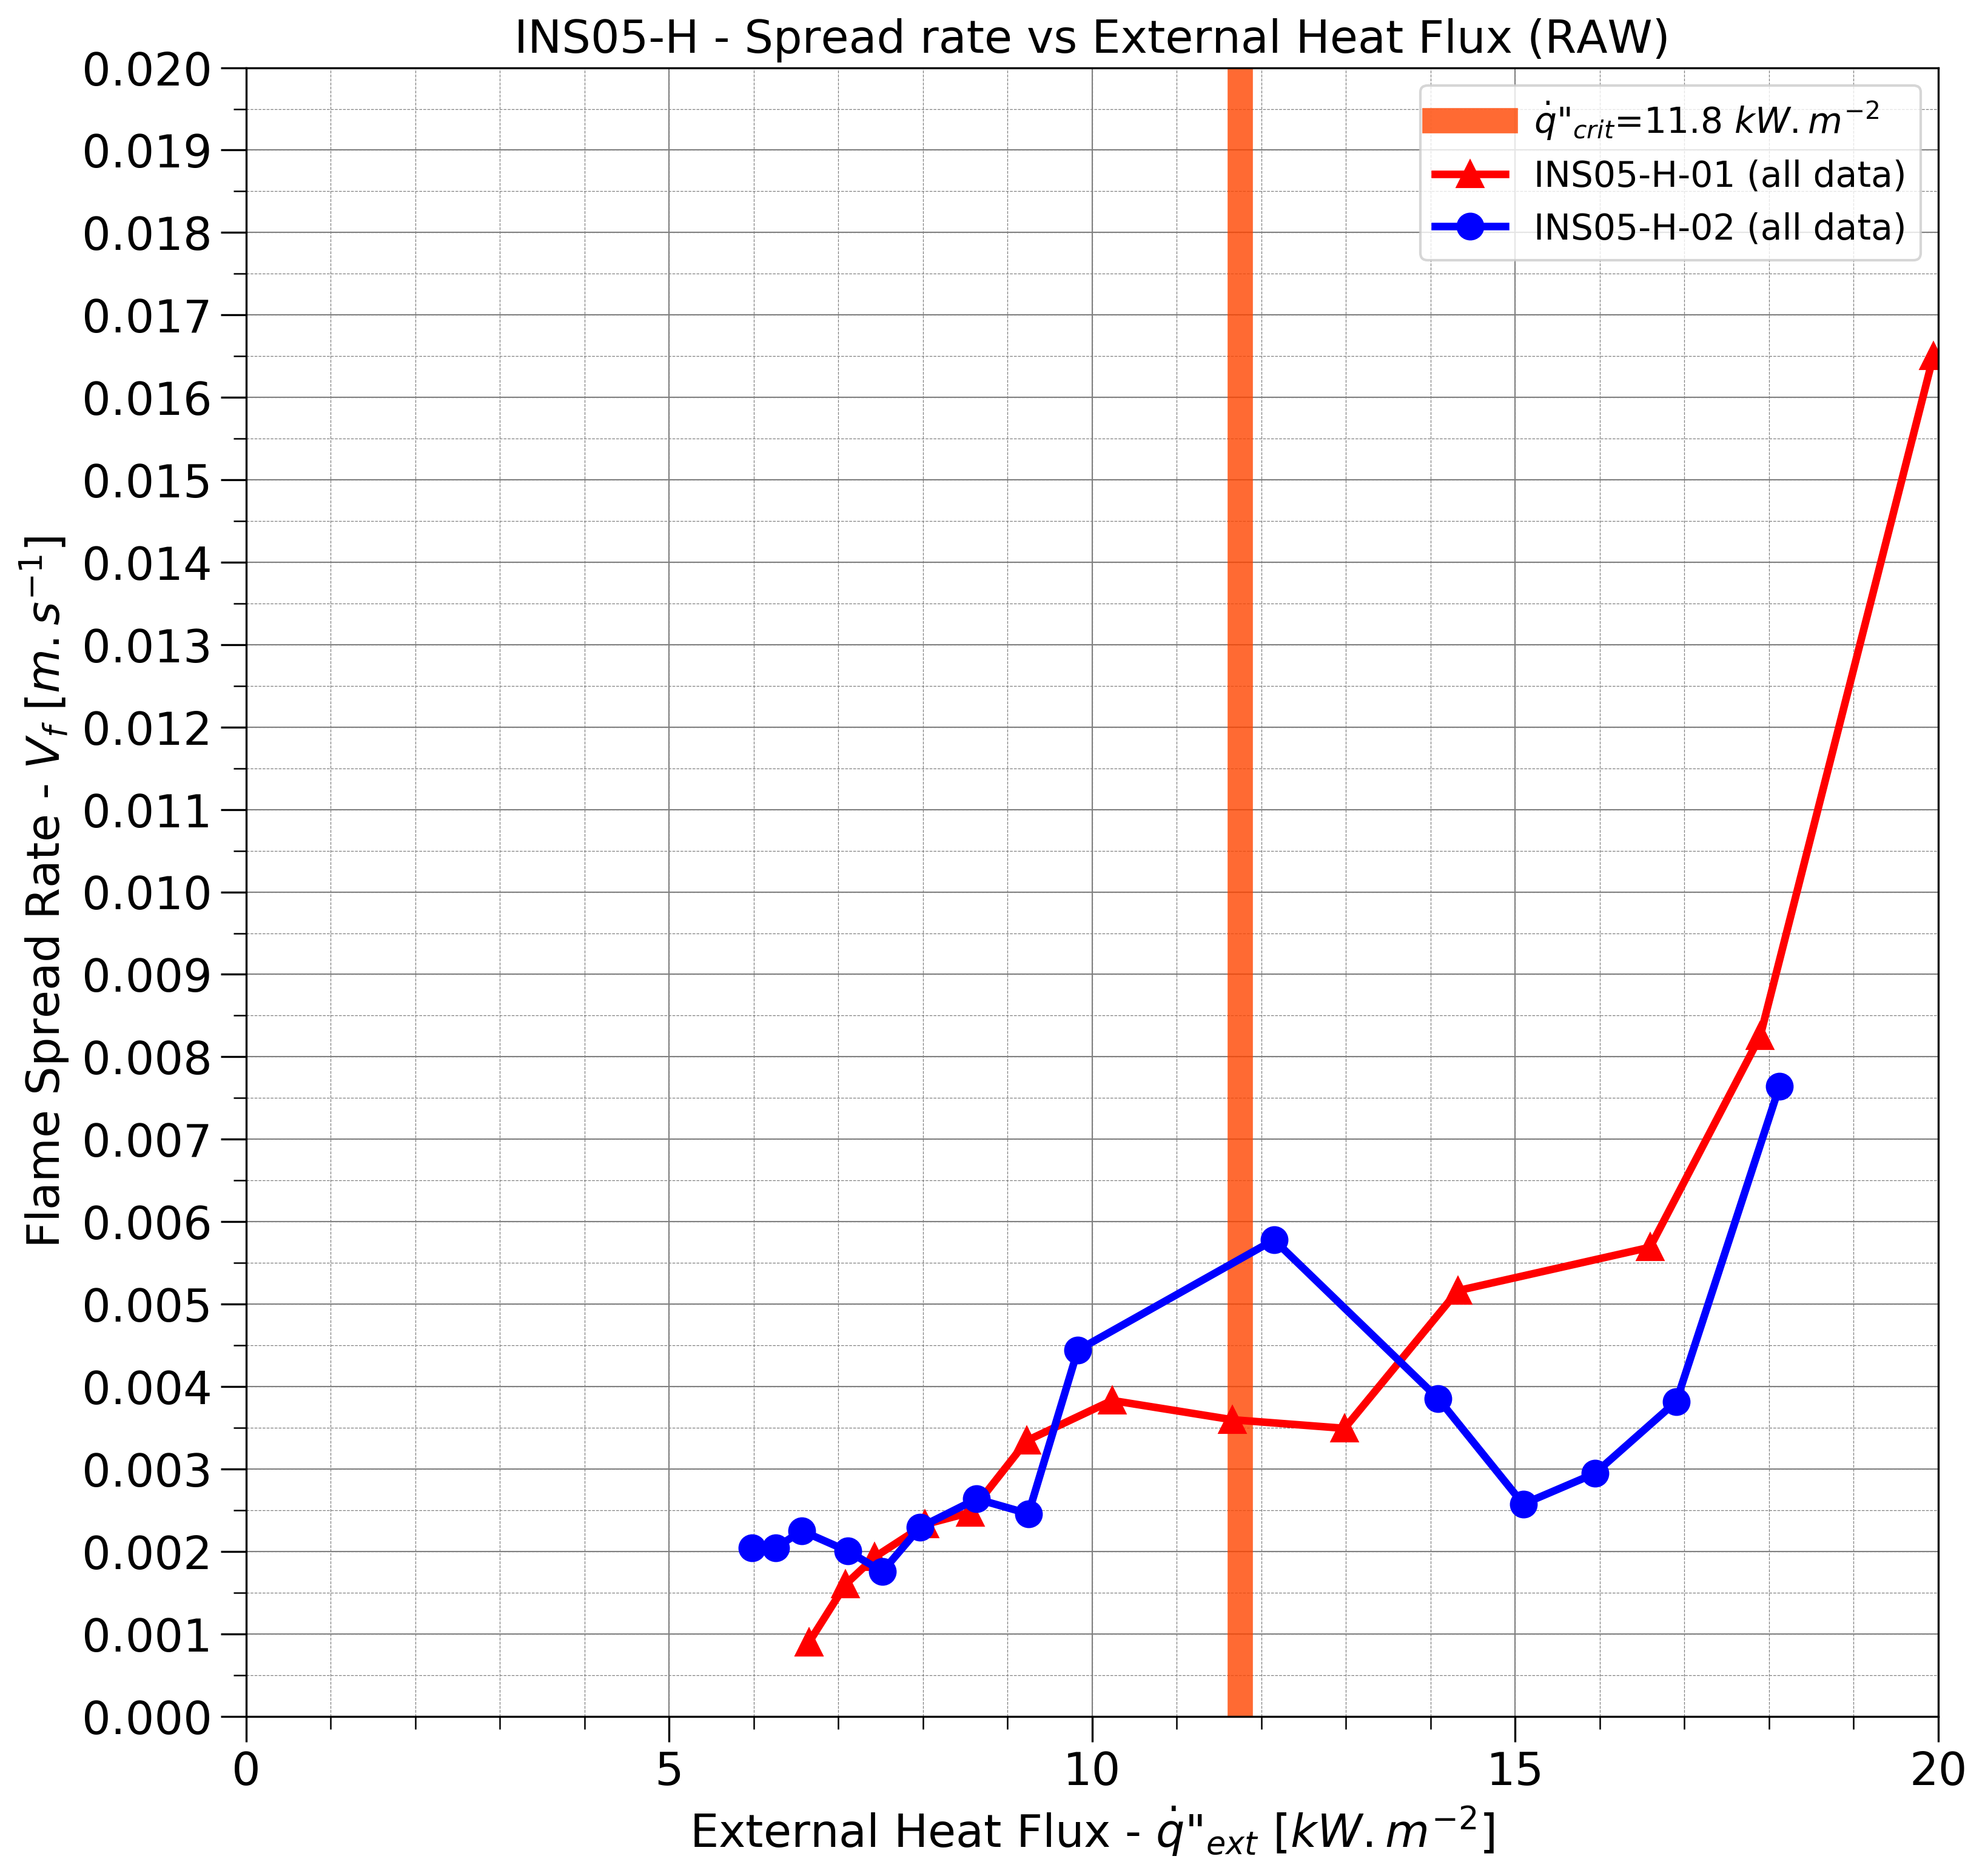
Figure 9. Lateral flame spread rate versus heat flux.
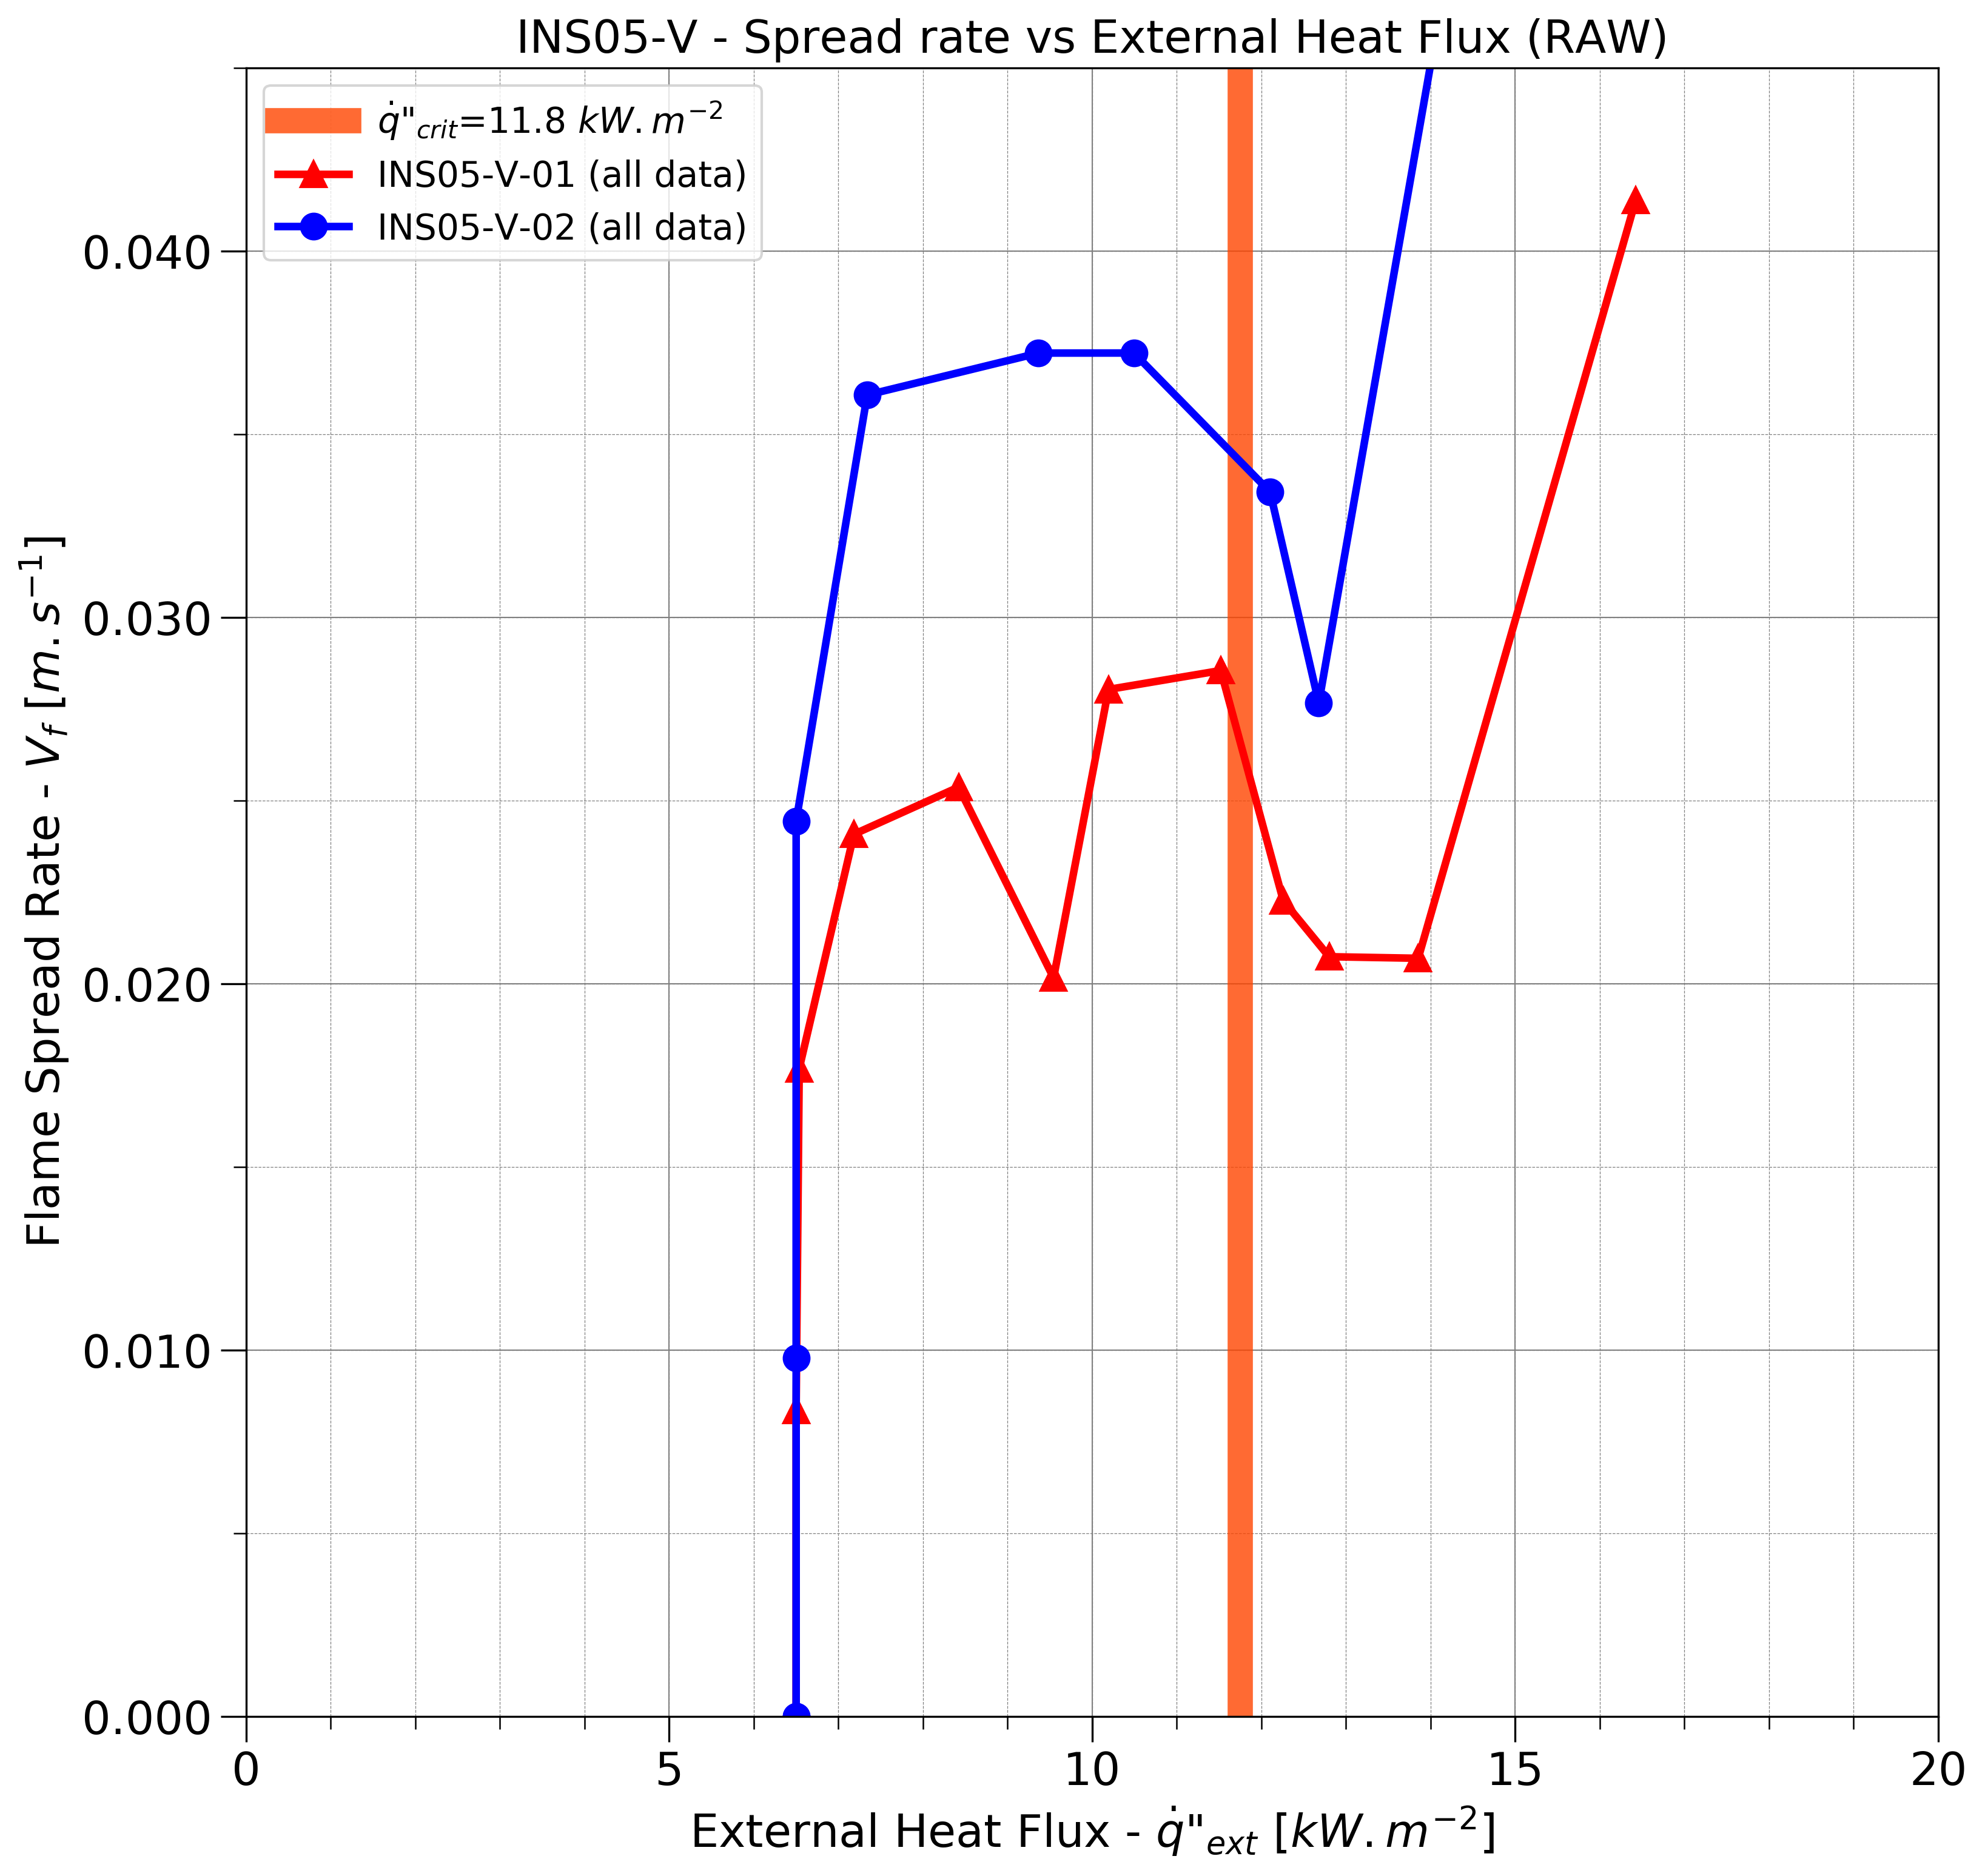
Figure 10. Vertical flame spread rate versus heat flux.
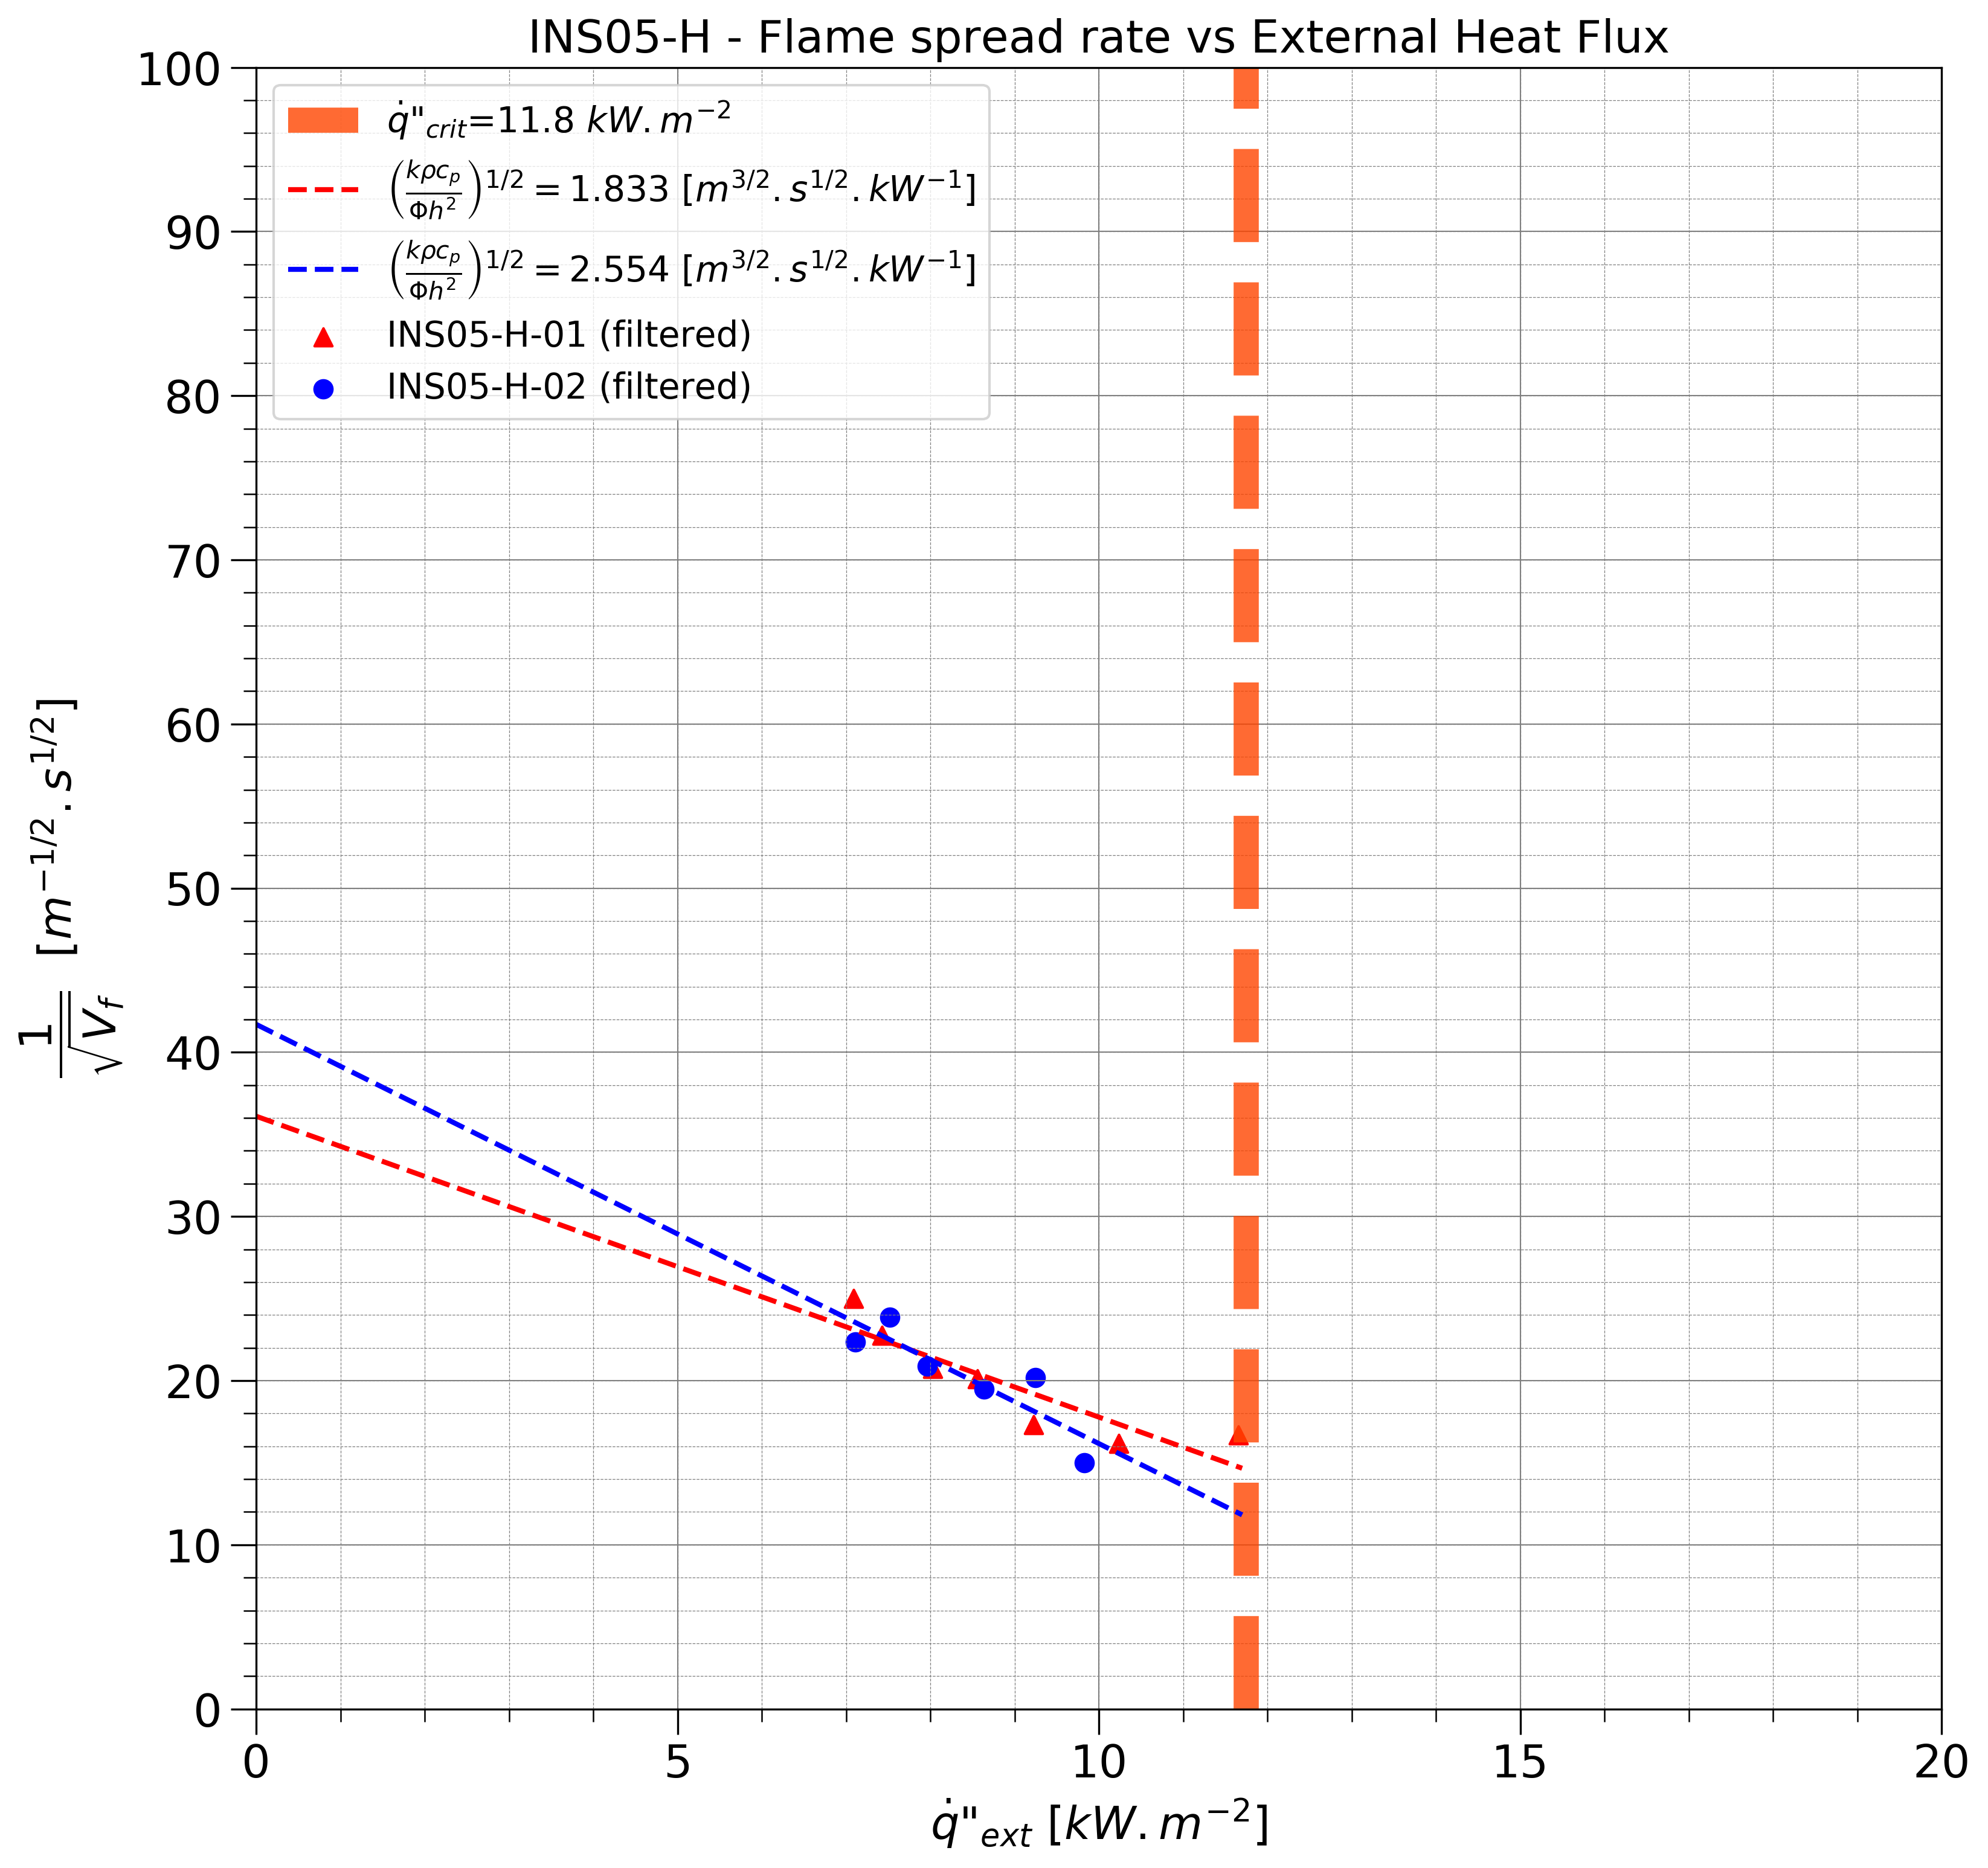
Figure 11. Vf-1/2 as function of q̇″ext in horizontal configuration.
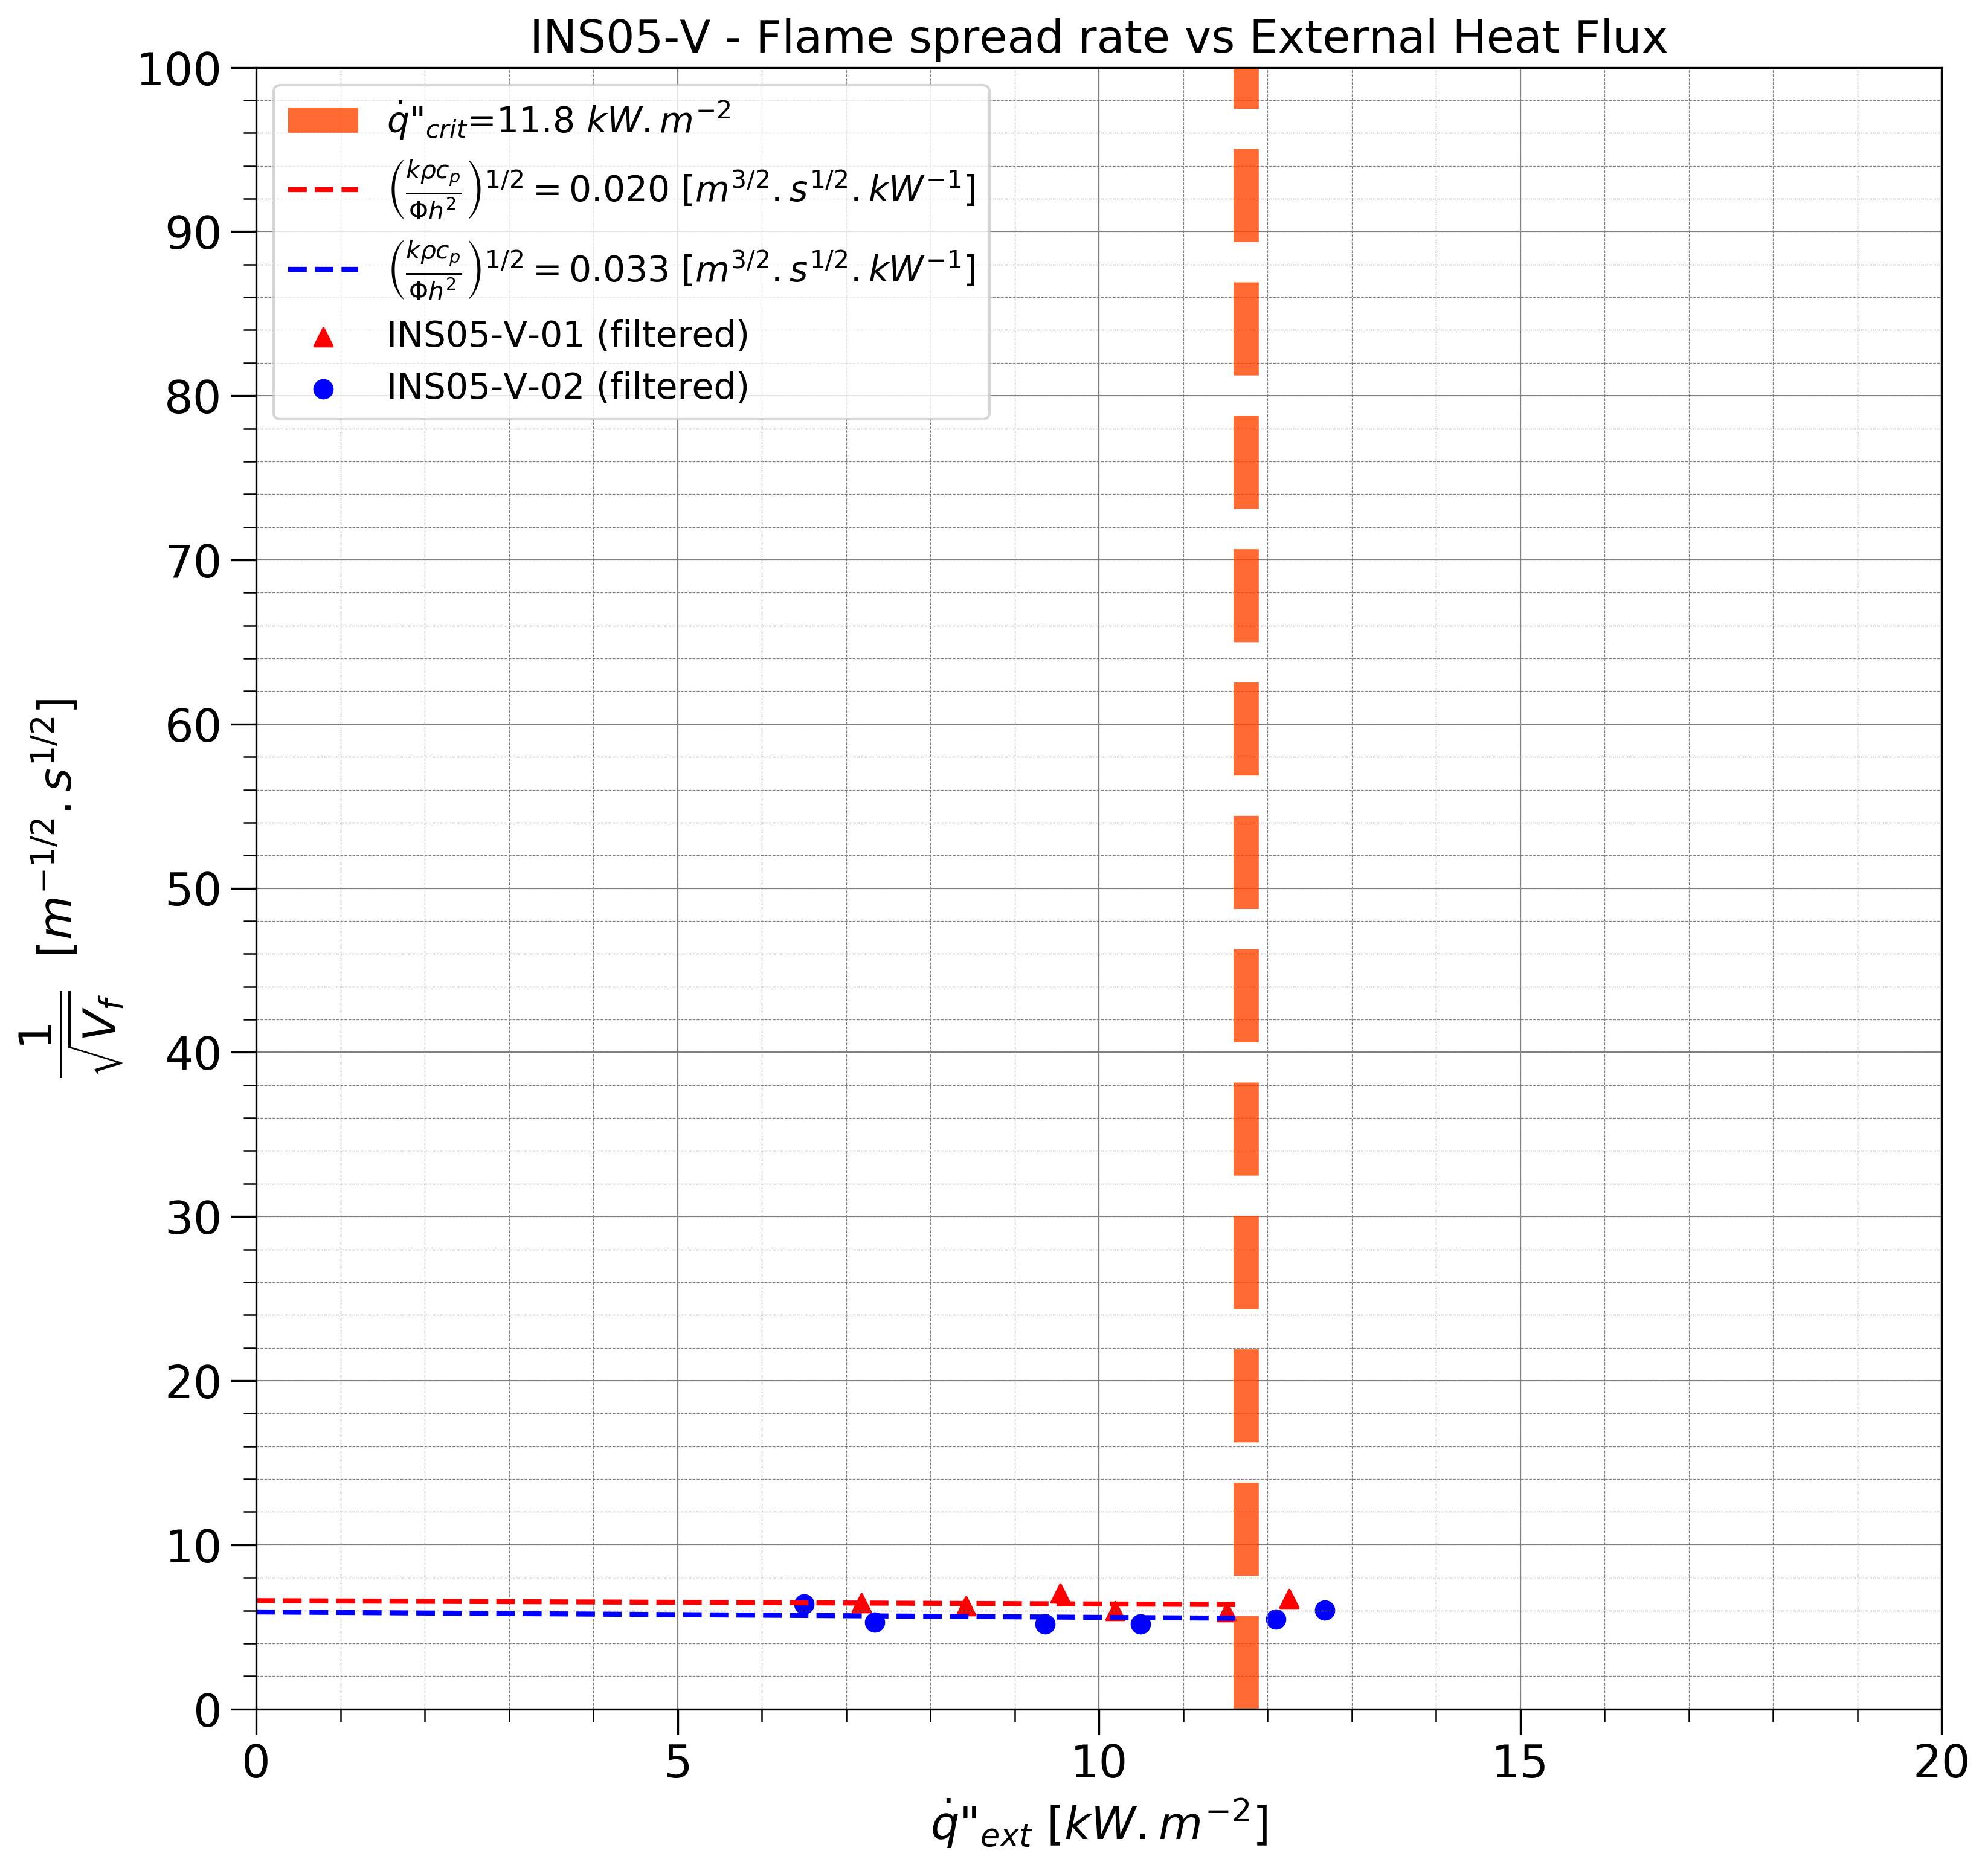
Table 12. Flame spread parameter results for sample.
| Orientation | Trial | (kρcp⁄Φh2)1⁄2 [m3⁄2 s1⁄2 kW-1] | Φ [kW2 m-3] |
|---|---|---|---|
| Horizontal | 1 | 1.833 | 42.77 |
| Horizontal | 2 | 2.544 | 22.03 |
| Vertical | 1 | - | 1000 |
| Vertical | 2 | - | 1000 |