
ACP10
Material description
Material ID: ACP10
Material type: Aluminium composite panel with a core consisting of an aluminium foil honeycomb structure connected with a polyurethane-based adhesive containing an inorganic filler.
Polymer: Polyurethane (-%)
Additives (fire retardants, fillers or traces of inorganic elements): Aluminium (96%), Magnesium (2%), Iron (1%), traces of other elements (<1%)
Core thickness: 4.26mm
Thickness of single metal skin: 1mm
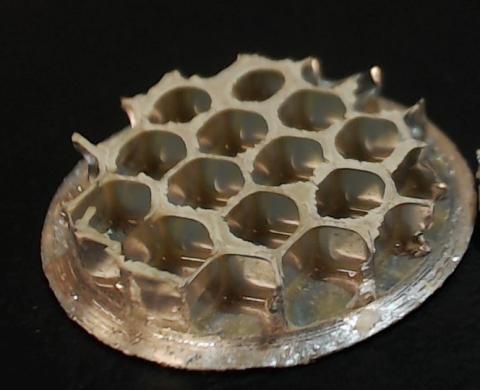
Table 1. Estimated mass concentration of compounds.
| Compound | Mass Concentration (%) |
|---|---|
| Polyurethane (PU) | - |
| Aluminium (Al) | 96 |
| Magnesium (Mg) | 2 |
| Iron (Fe) | 1 |
| Traces of sodium (Na) | <1 |
| Traces of silicon (Si) | <1 |
| Traces of manganese (Mn) | <1 |
| Traces of copper (Cu) | <1 |
| Traces of calcium (Ca) | <1 |
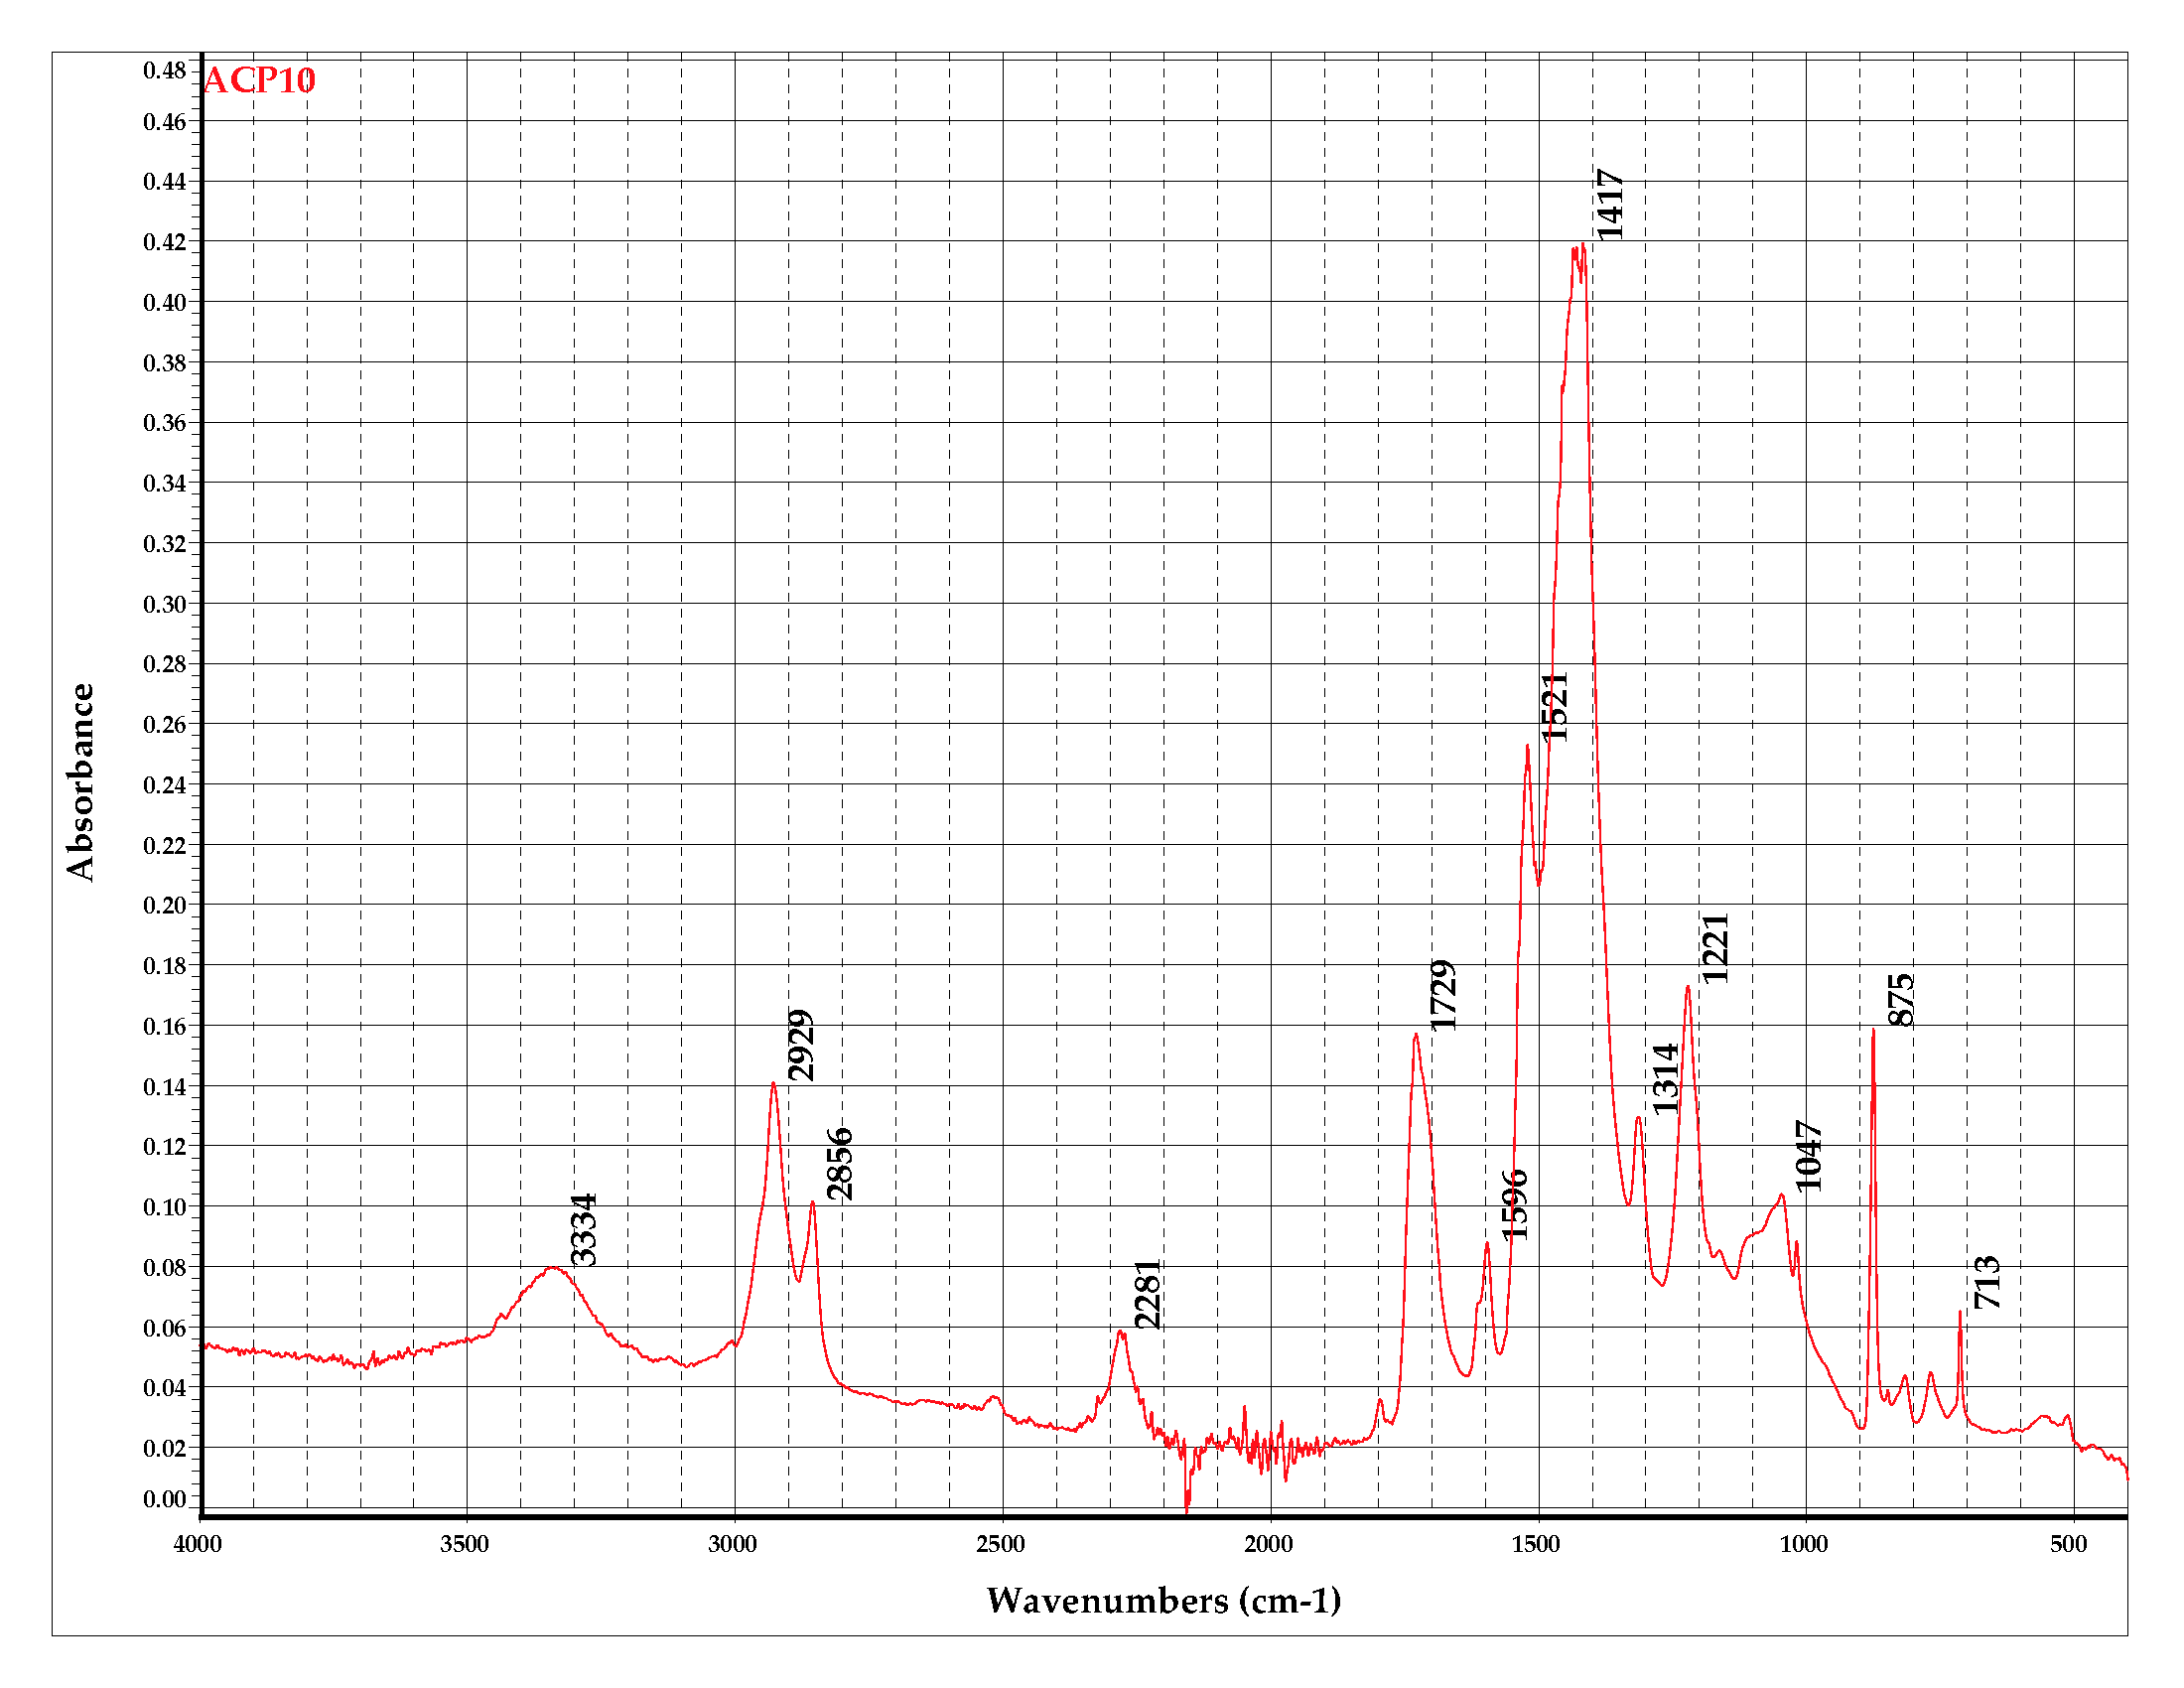
Figure 1 . FTIR spectra: Absorbance percentage versus wavenumber from the sample.
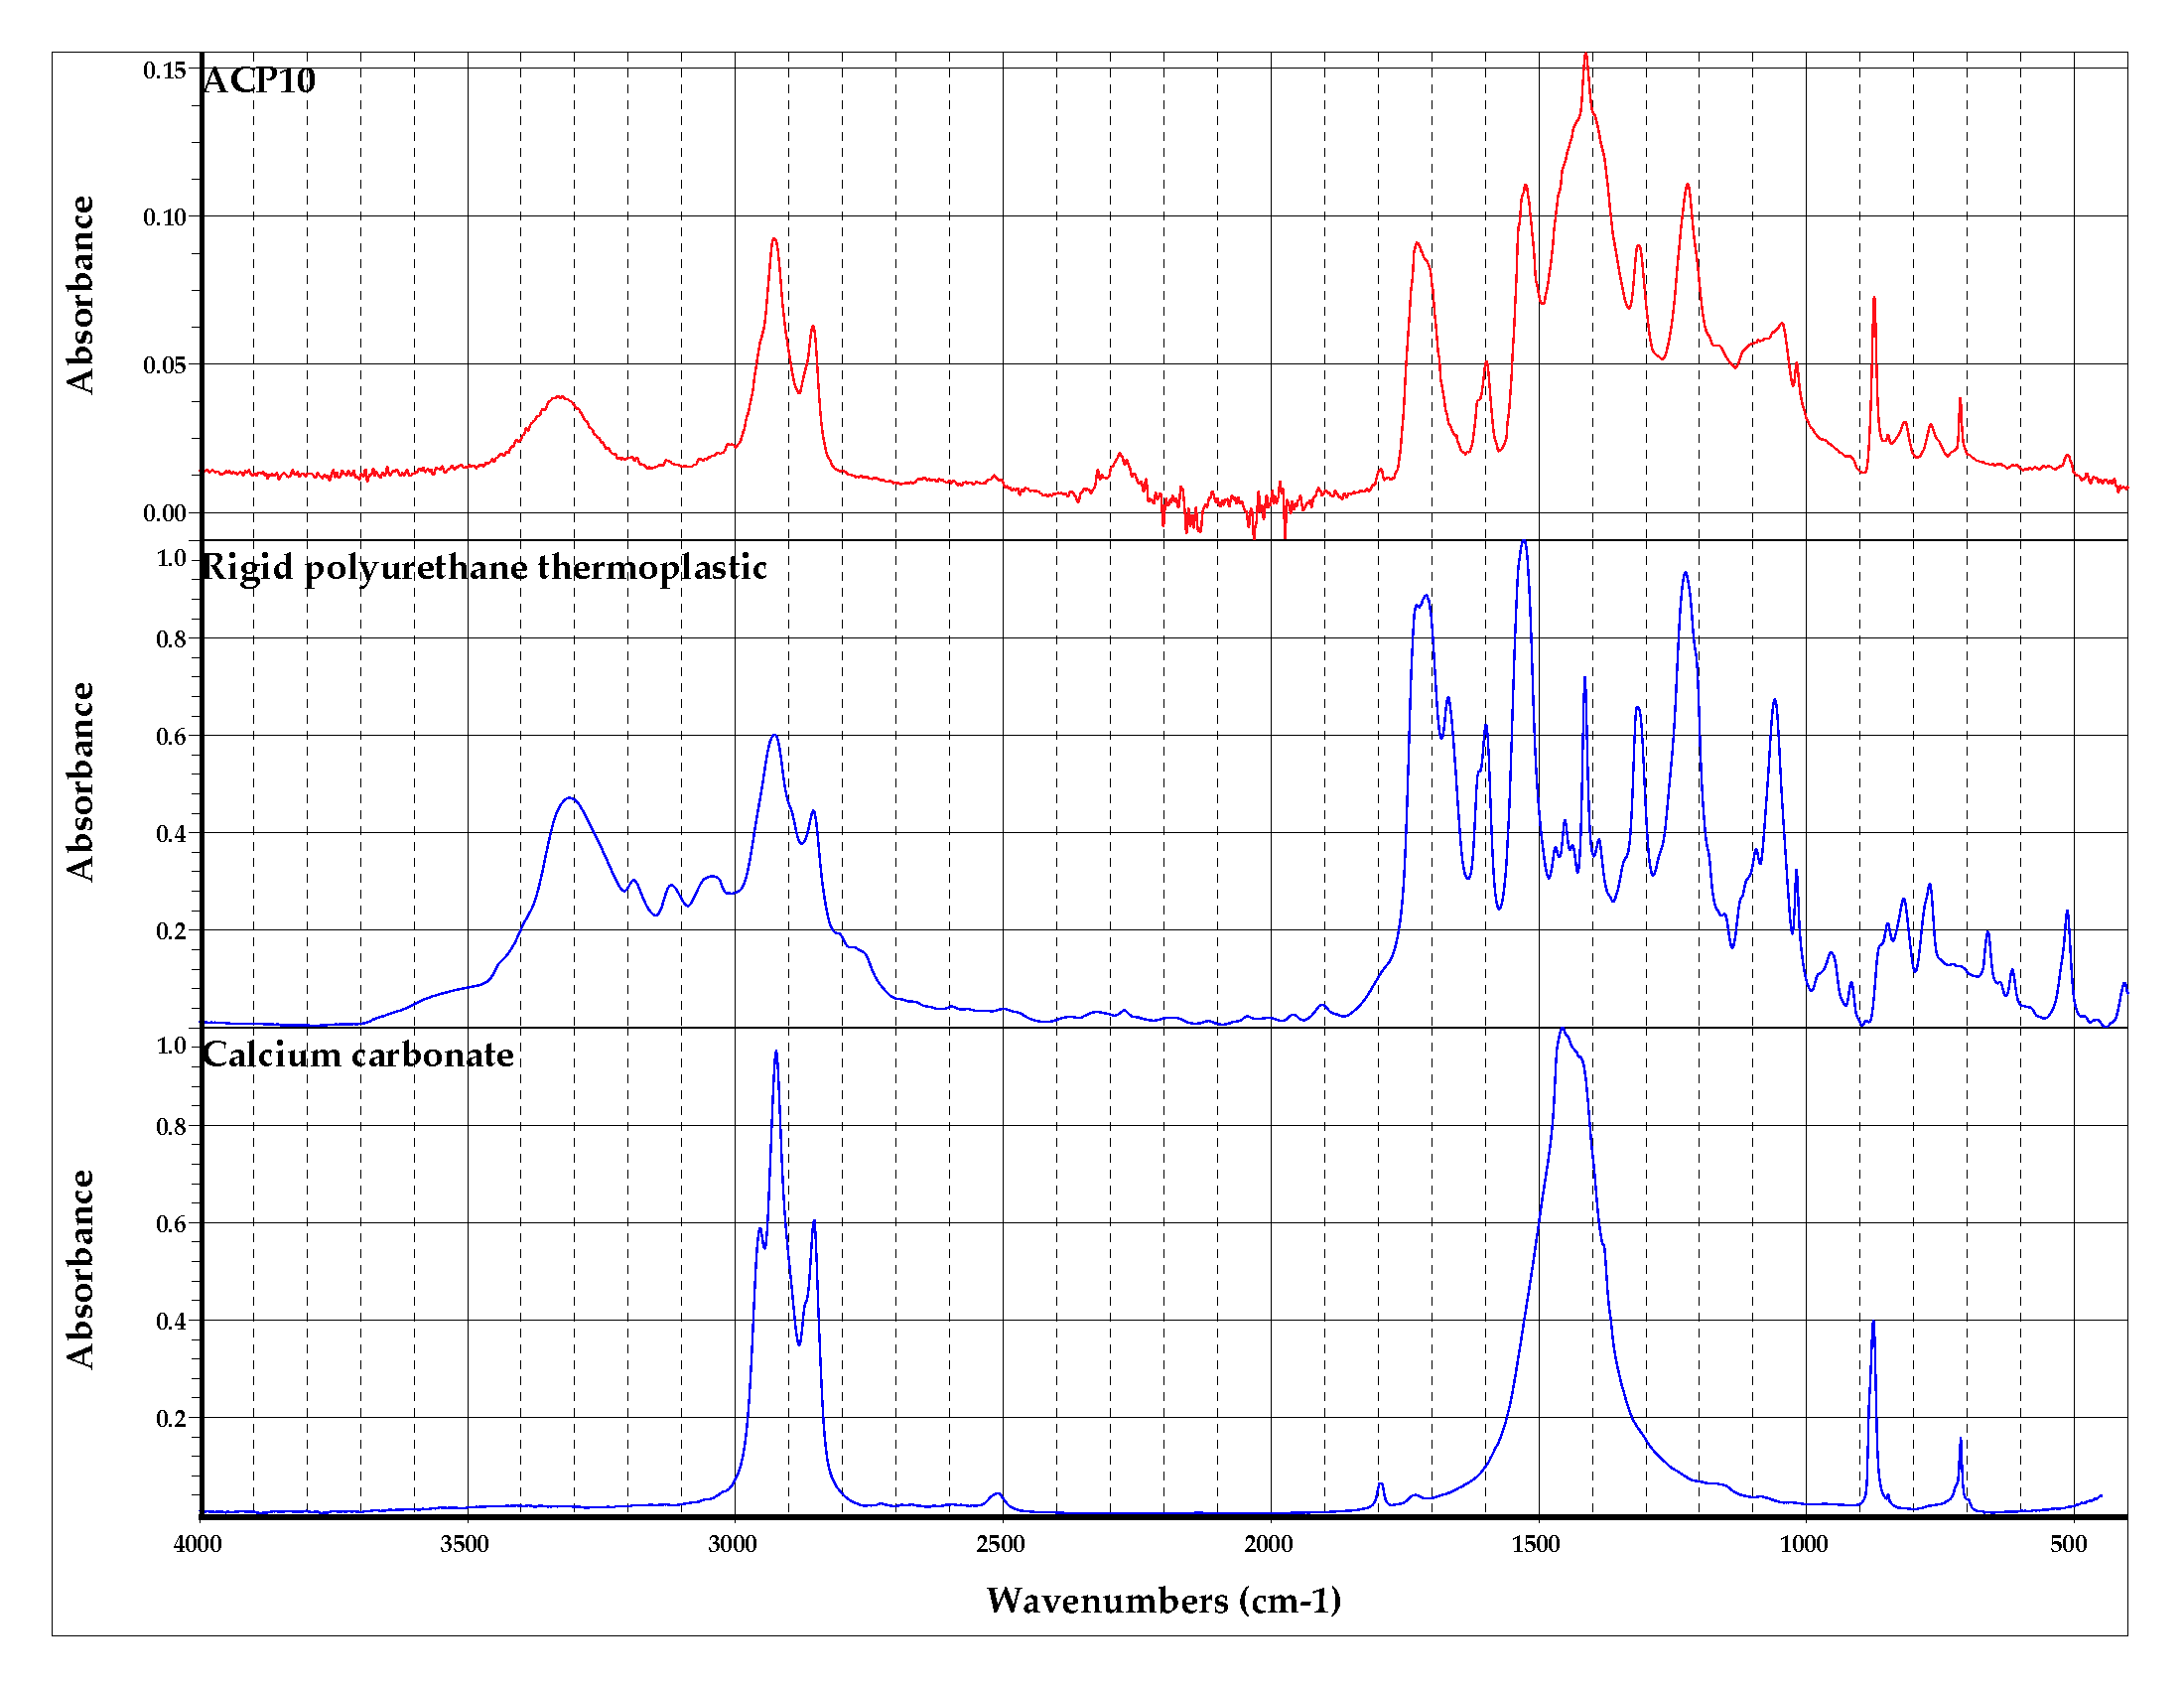
Figure 2. FTIR spectra: Absorbance percentage versus wavenumber from the sample and the identified compounds.
A.2 Energy Dispersive X-Ray Fluorescence (EDXRF)
Table 2. Inorganic elements and their mass concentration identified with EDXRF.
| Element | Mass Concentration (%) |
|---|---|
| Al | 96 |
| Mg | 2 |
| Fe | 1 |
| Na | <1 |
| Si | <1 |
| Mn | <1 |
| Cu | <1 |
| Ca | <1 |
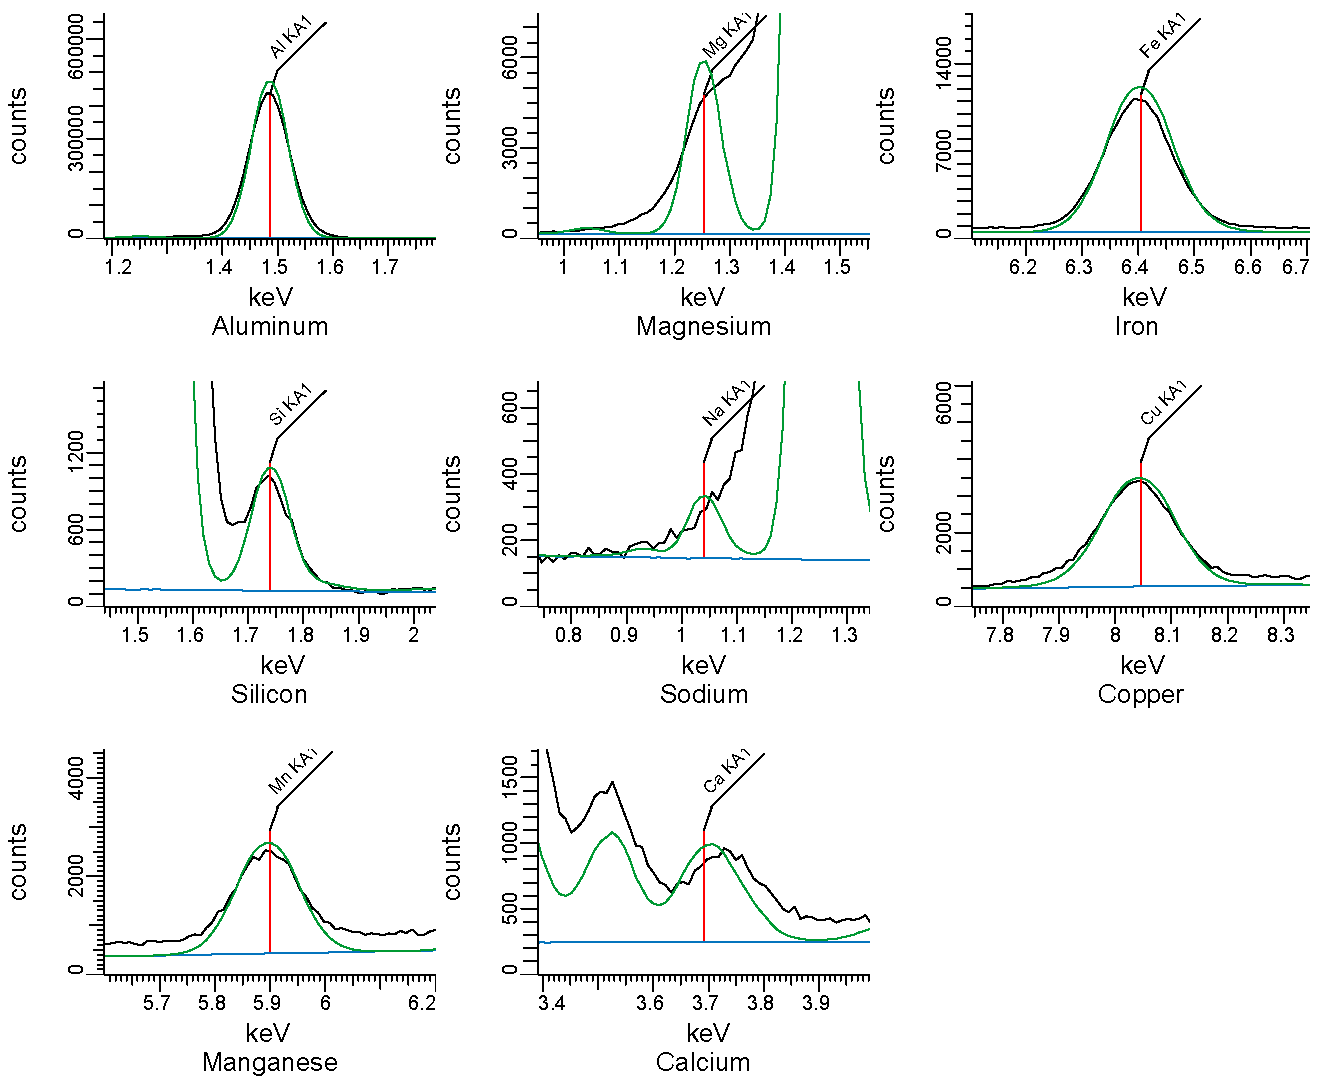
Figure 3. EDXRF spectra. Counts vs energy. Identified elements are shown as vertical lines.
B. Thermogravimetric analysis
Table 3. Mass fraction of residue after thermal decomposition.
| Condition | Fraction of mass residue at 800°C |
|---|---|
| Non-oxidative (nitrogen) | 0.29 |
| Oxidative (air) | 0.25 |
Table 4. Temperature and amplitude of main peaks in non-oxidative conditions.
| Peak ID | Temperature peak (°C) | Amplitude of peak (°C-1) |
|---|---|---|
| Peak 1 | 326 | 2.96 x 10⁻³ |
| Peak 2 | 383 | 2.56 x 10⁻³ |
| Peak 3 | 473 | 3.38 x 10⁻³ |
| Peak 4 | 749 | 2.48 x 10⁻³ |
Table 5. Temperature and amplitude of main peaks in oxidative conditions.
| Peak ID | Temperature peak (°C) | Amplitude of peak (°C-1) |
|---|---|---|
| Peak 1 | 323 | 4.32 x 10⁻³ |
| Peak 2 | 460 | 1.86 x 10⁻³ |
| Peak 3 | 516 | 7.25 x 10⁻³ |
| Peak 4 | 732 | 2.13 x 10⁻³ |
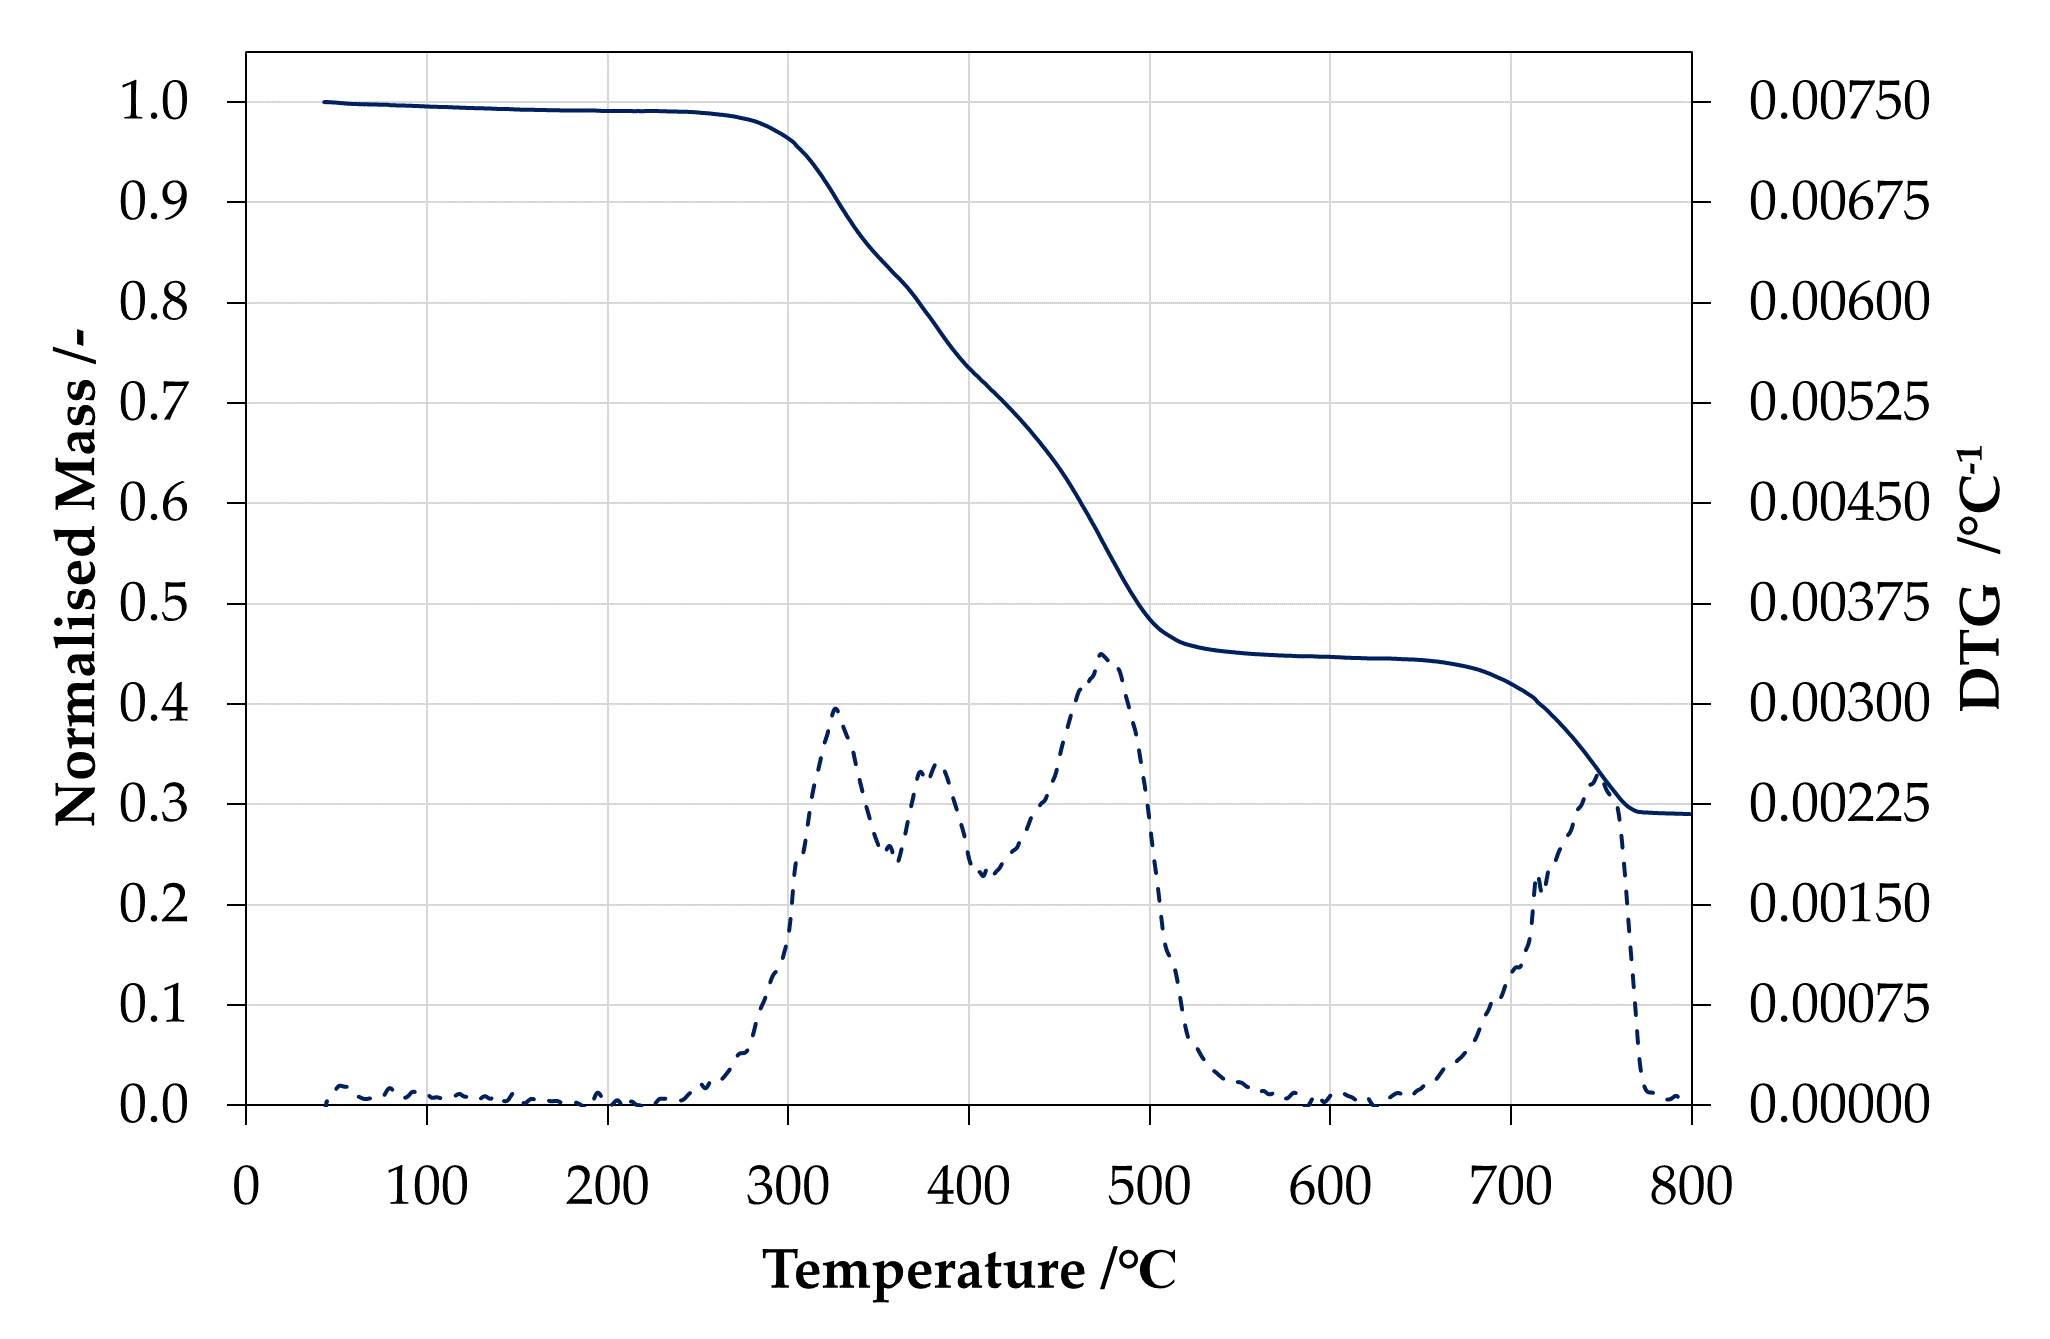
Figure 4. Normalised mass (solid line) and derivative of the normalised mass (dashed line) in 150 ml min-1 of nitrogen and a heating rate of 20°C min-1.
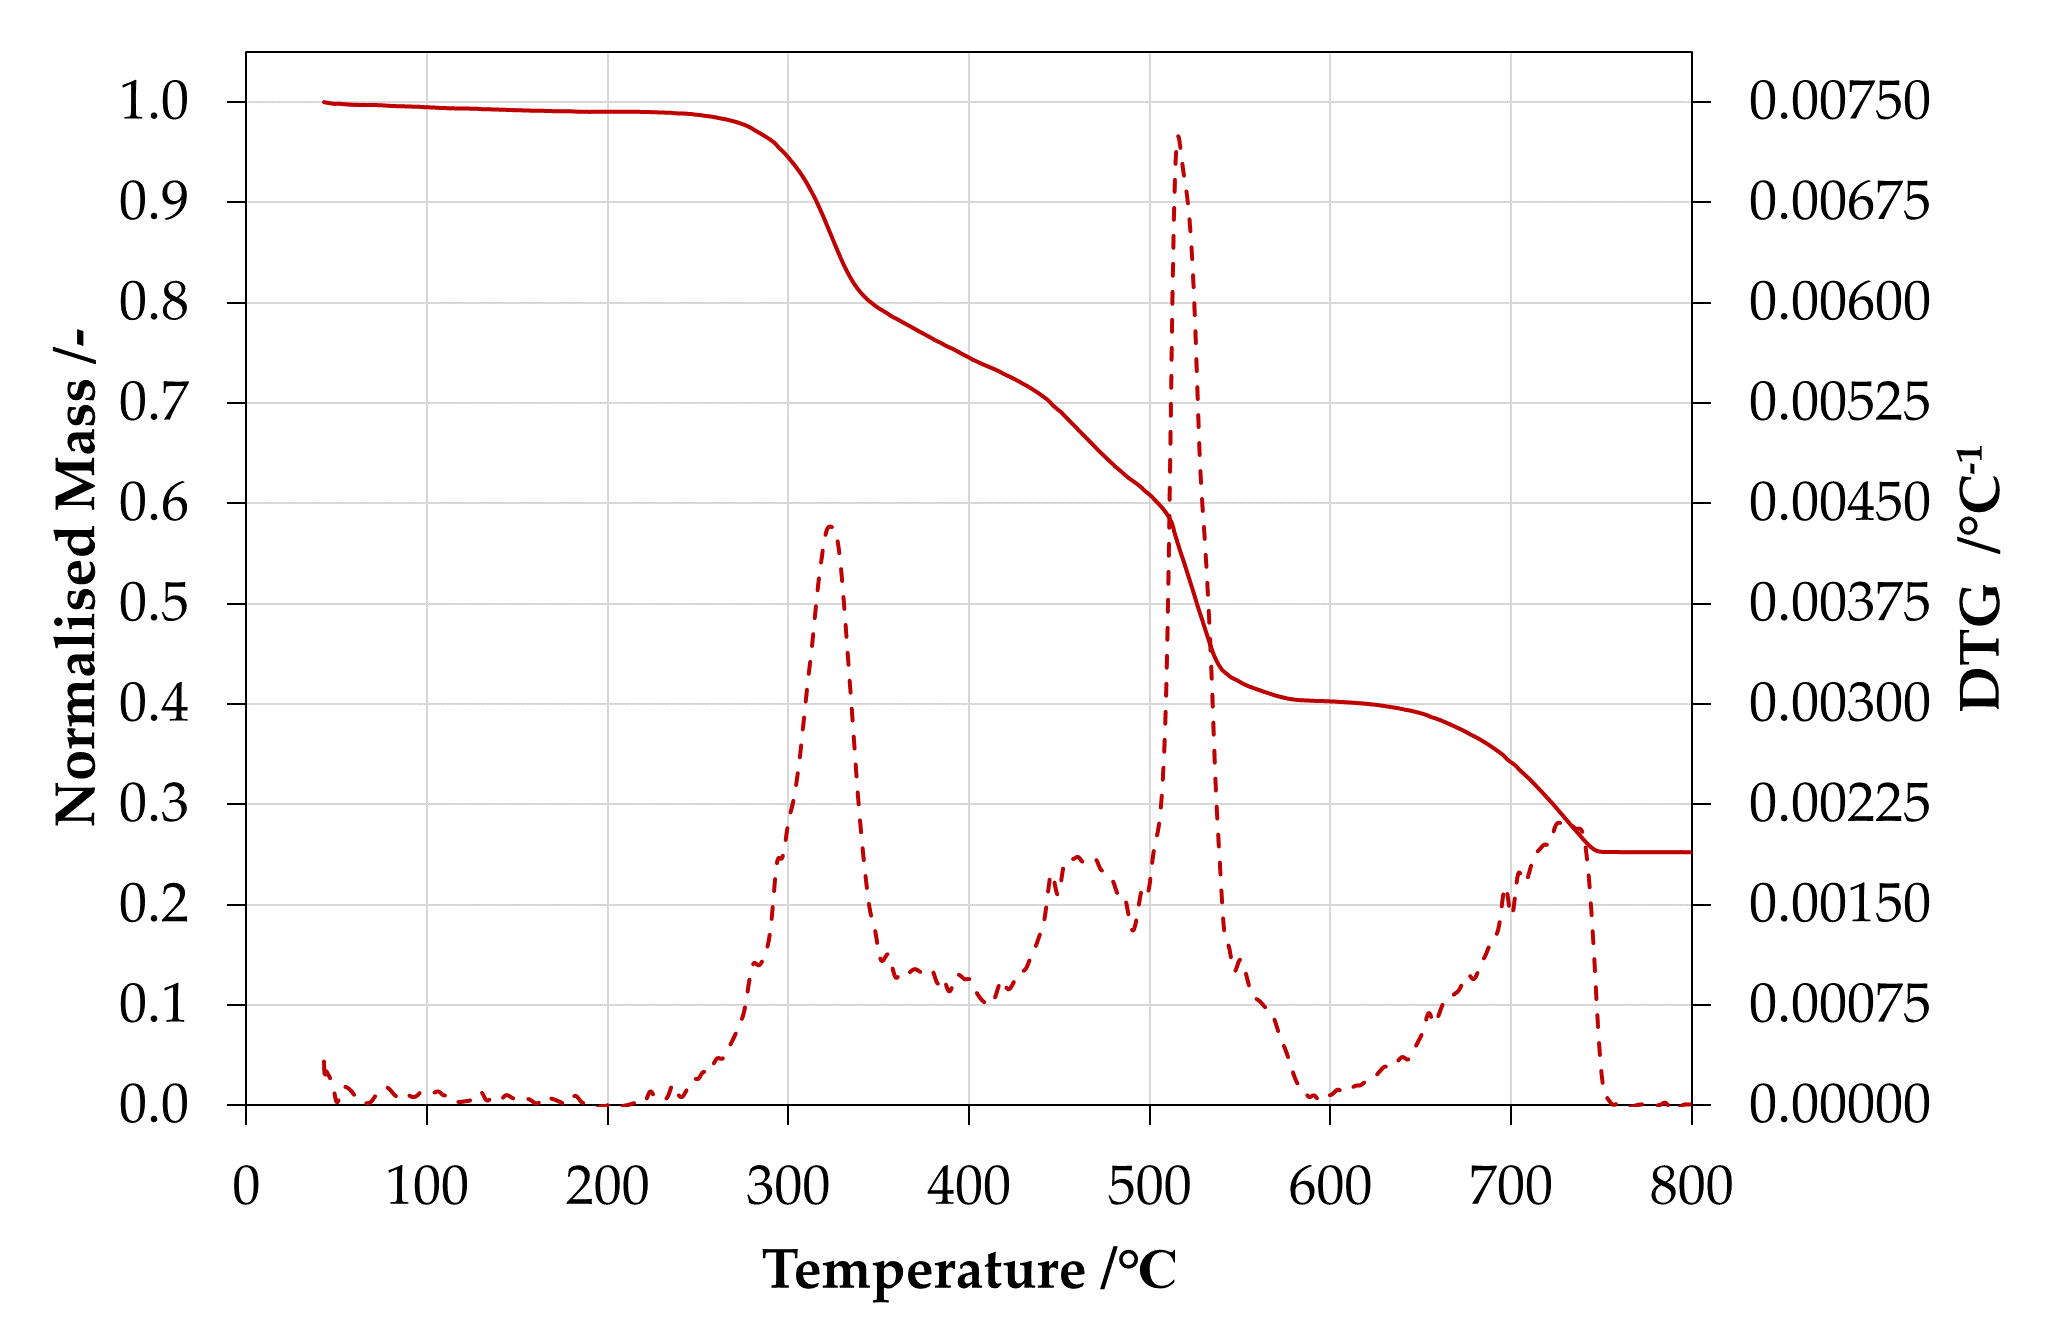
Figure 5. Normalised mass (solid line) and derivative of the normalised mass (dashed line) in 150 ml min-1 of air and a heating rate of 20°C min-1 .
C. Gross Heat of Combustion
Table 7. Gross Heat of Combustion individual results for sample.| Trial | ΔHc [kJ g-1] |
|---|---|
| Trial 1 | 19.57 |
| Trial 2 | 20.14 |
| Trial 3 | 18.94 |
| Average | 19.55 |
| Std dev | 0.60 |
Only the organic component (the resin) is tested in the bomb calorimeter, as described in Protocols for the Material Library supporting documents.
D. Ignition parameters
Table 8. Summary of ignition parameters for sample.| Critical heat flux for ignition | Ignition temperature | Total heat transfer coefficient of losses | Apparent thermal inertia |
|---|---|---|---|
| q̇″cr [kW m−2] | Tig [°C] | hr [W m-2 K-1] | kρc [kW2 m-4 K-2 s] |
| 15.40 | 376 | 38.90 | 0.466 |
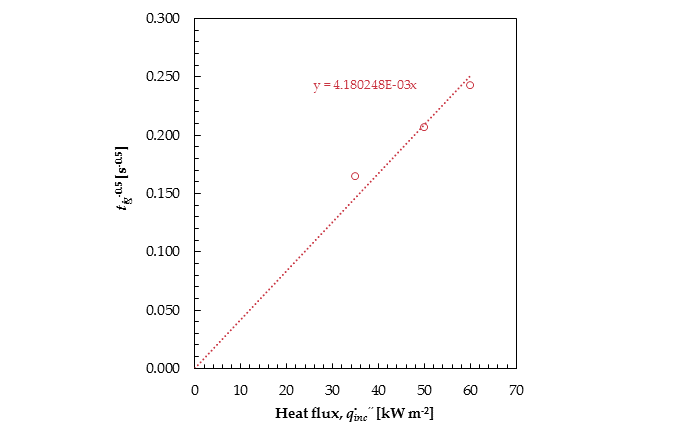
Figure 6. Time-to-ignition vs incident radiant heat flux for samples.
E. Burning behaviour
Table 9. Summary of key burning behaviour metrics.
| Heat flux | Test | Time to ignition | Fraction of mass residue | Peak heat release rate | Total energy released |
|---|---|---|---|---|---|
| q̇″inc [kW m-2] | tig [s] | mres [-] | q̇″p [kW m-2] | Qt [MJ m-2] | |
| 35 kW m-2 | |||||
| Test 1 | 39 | 0.66 | 205.18 | 8.09 | |
| Test 2 | 35 | 0.65 | 225.71 | 8.54 | |
| Avg | 37 | 0.66 | 215.44 | 8.31 | |
| 50 kW m-2 | |||||
| Test 1 | 24 | 0.65 | 320.69 | 17.52 | |
| Test 2 | 23 | 0.70 | 322.83 | 14.80 | |
| Avg | 24 | 0.67 | 321.76 | 16.16 | |
| 60 kW m-2 | |||||
| Test 1 | 18 | 0.81 | 304.01 | 8.48 | |
| Test 2 | 16 | 0.84 | 334.99 | 8.55 | |
| Avg | 17 | 0.83 | 319.50 | 8.52 | |
| 80 kW m-2 | |||||
| Test 1 | - | - | - | - | |
| Test 2 | - | - | - | - | |
| Avg | - | - | - | - |
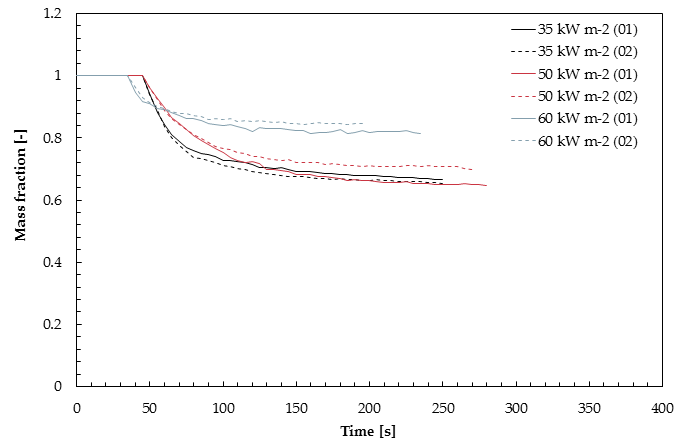
Figure 7. Normalised mass loss over time for samples tested with 35, 50, 60 and 80 kW m-2.
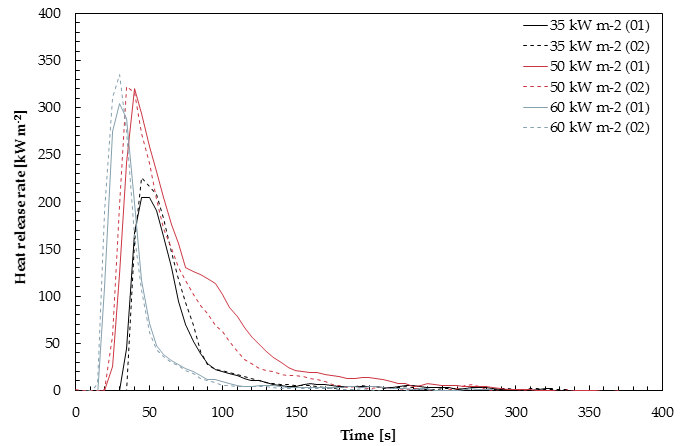
Figure 8. Heat release rate per unit area over time for samples tested with 35, 50, 60 and 80 kW m-2.
| Test | ΔHc [kJ g-1] |
|---|---|
| 35 kW m-2 (Test 1) | 42.36 |
| 35 kW m-2 (Test 2) | 39.83 |
| 50 kW m-2 (Test 1) | 43.89 |
| 50 kW m-2 (Test 2) | 52.74 |
| 60 kW m-2 (Test 1) | 78.60 |
| 60 kW m-2 (Test 2) | 90.90 |
| 80 kW m-2 (Test 1) | - |
| 80 kW m-2 (Test 2) | - |
| Average | 58.05 |
| Std dev | 21.49 |
F. Flame Spread
Table 11. Minimum heat flux for flame spread rate and minimum flame spread rate for sample.| Orientation | q̇″min.spread [kW m-2] | Vf.min [mm s-1] |
|---|---|---|
| Horizontal | 7.80 | 1 |
| Vertical | 7.90 | 16.40 |
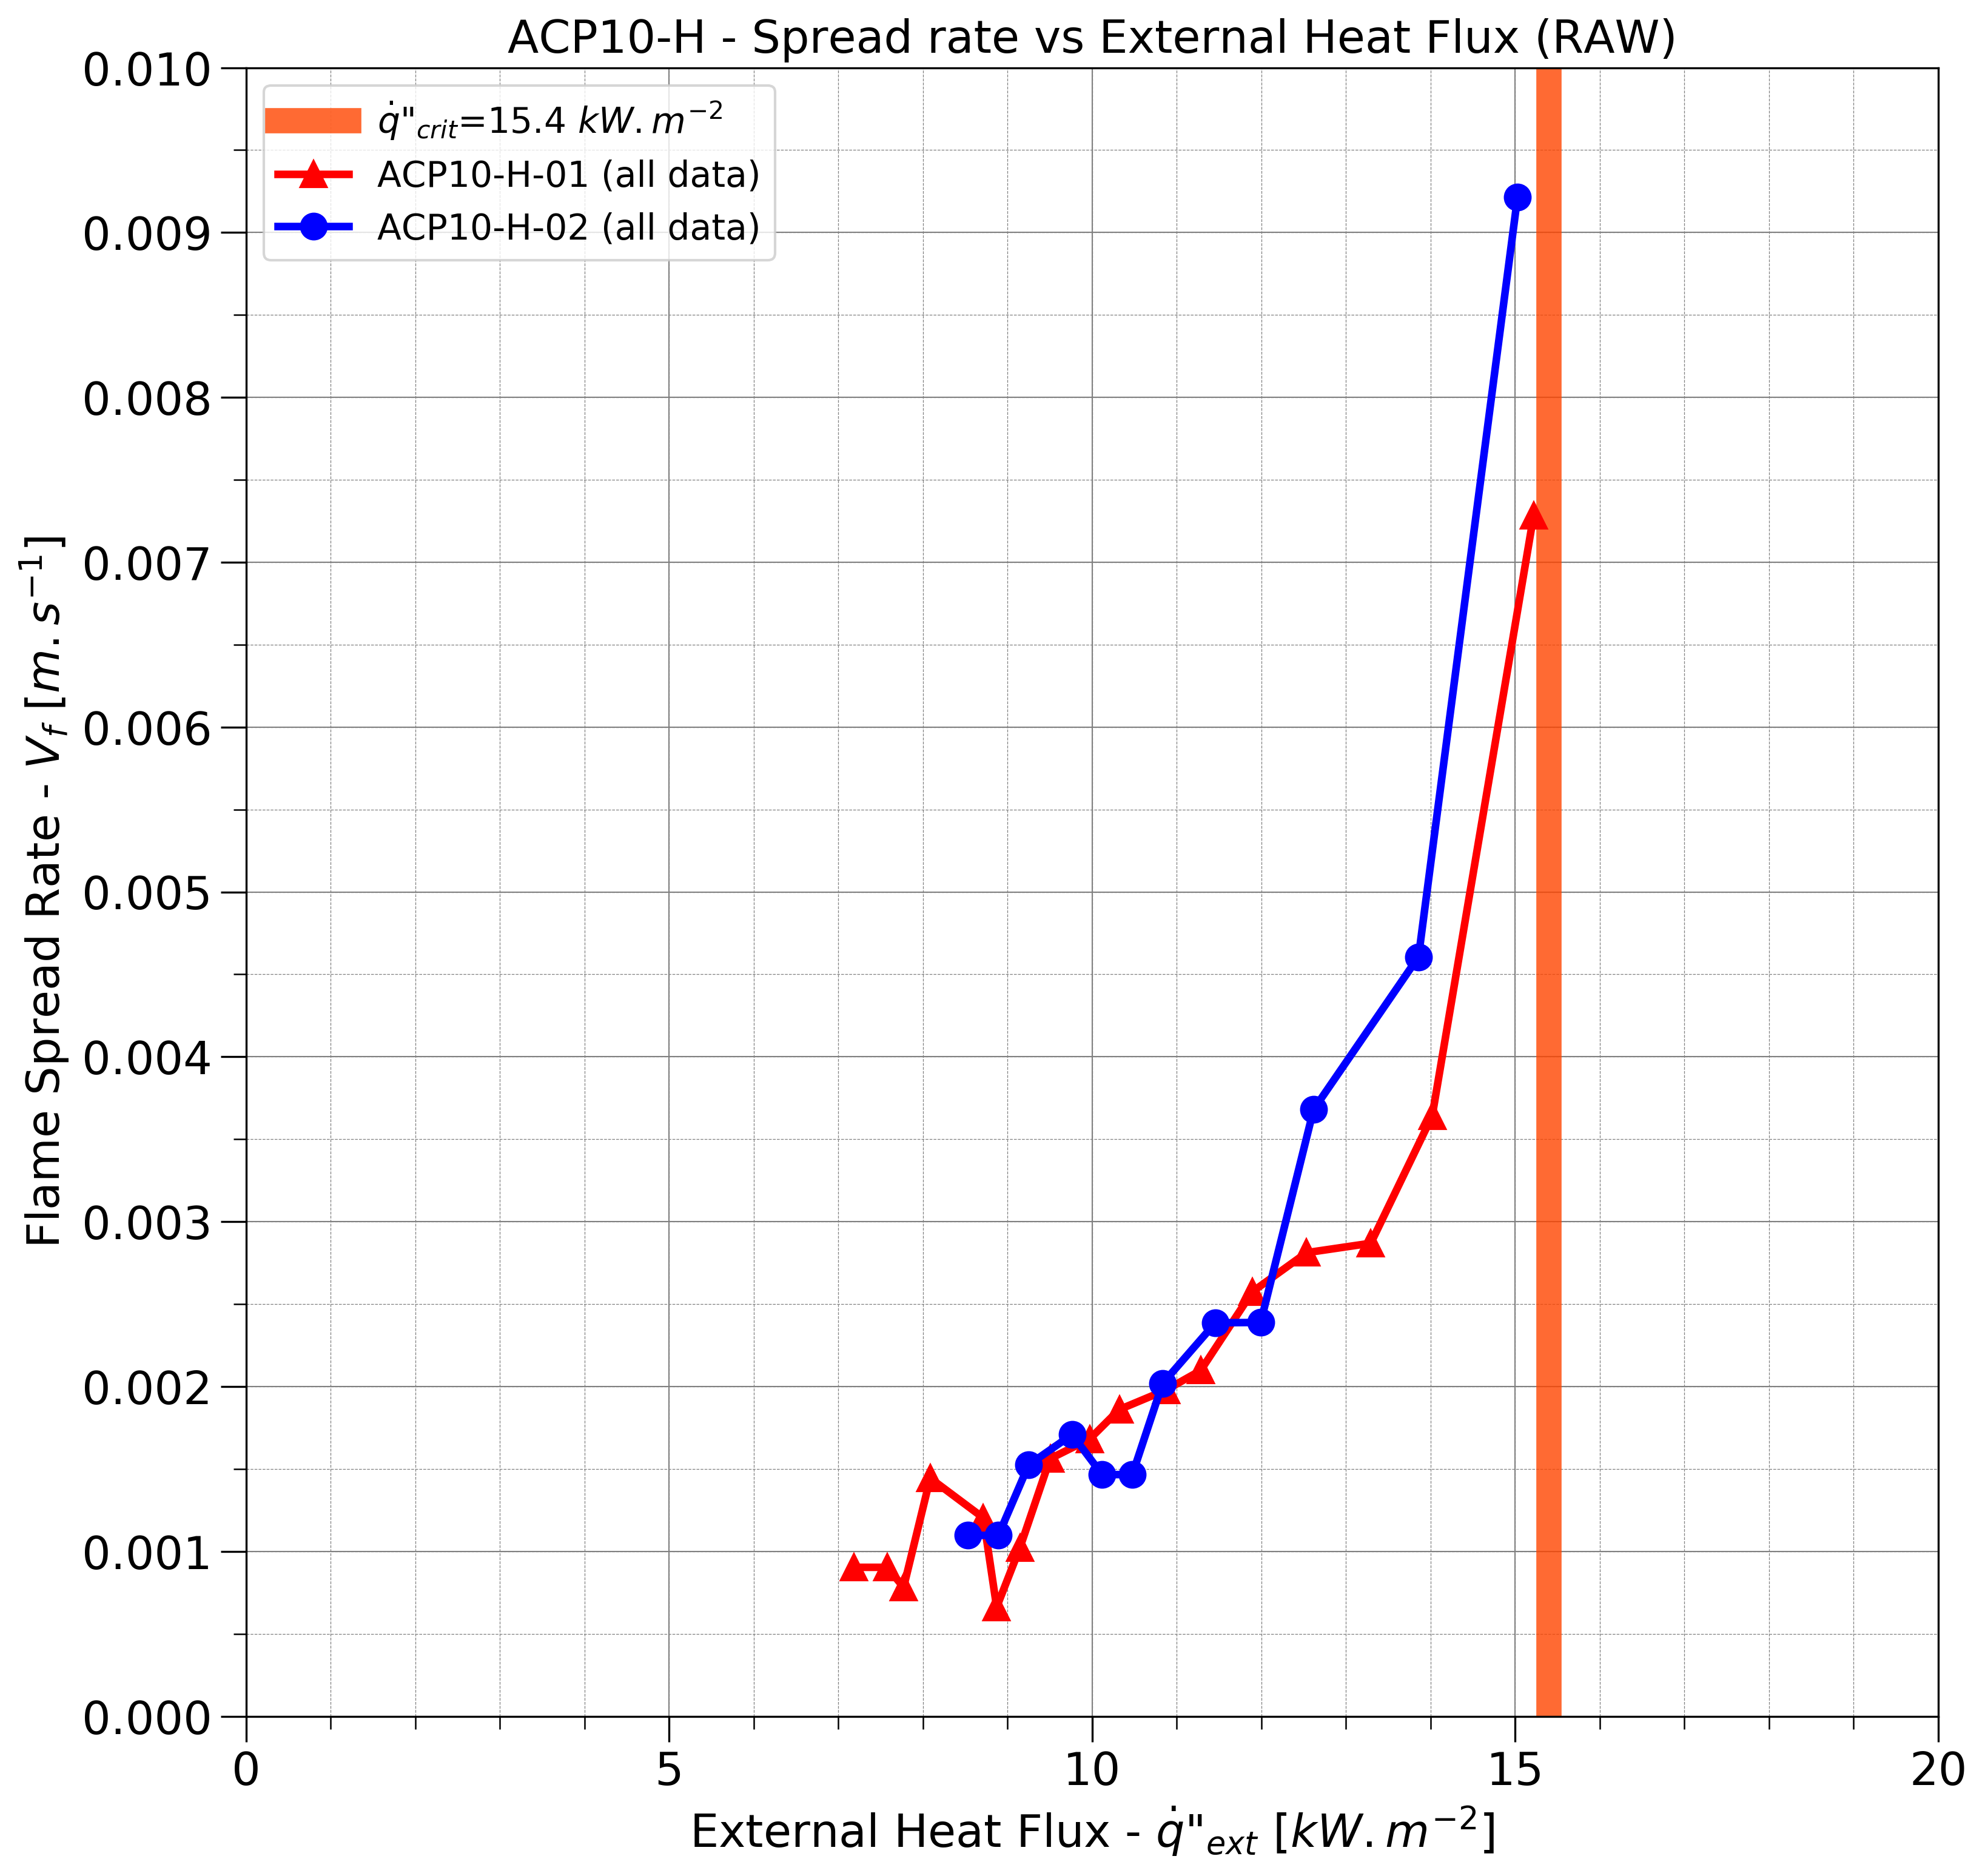
Figure 9. Lateral flame spread rate versus heat flux.
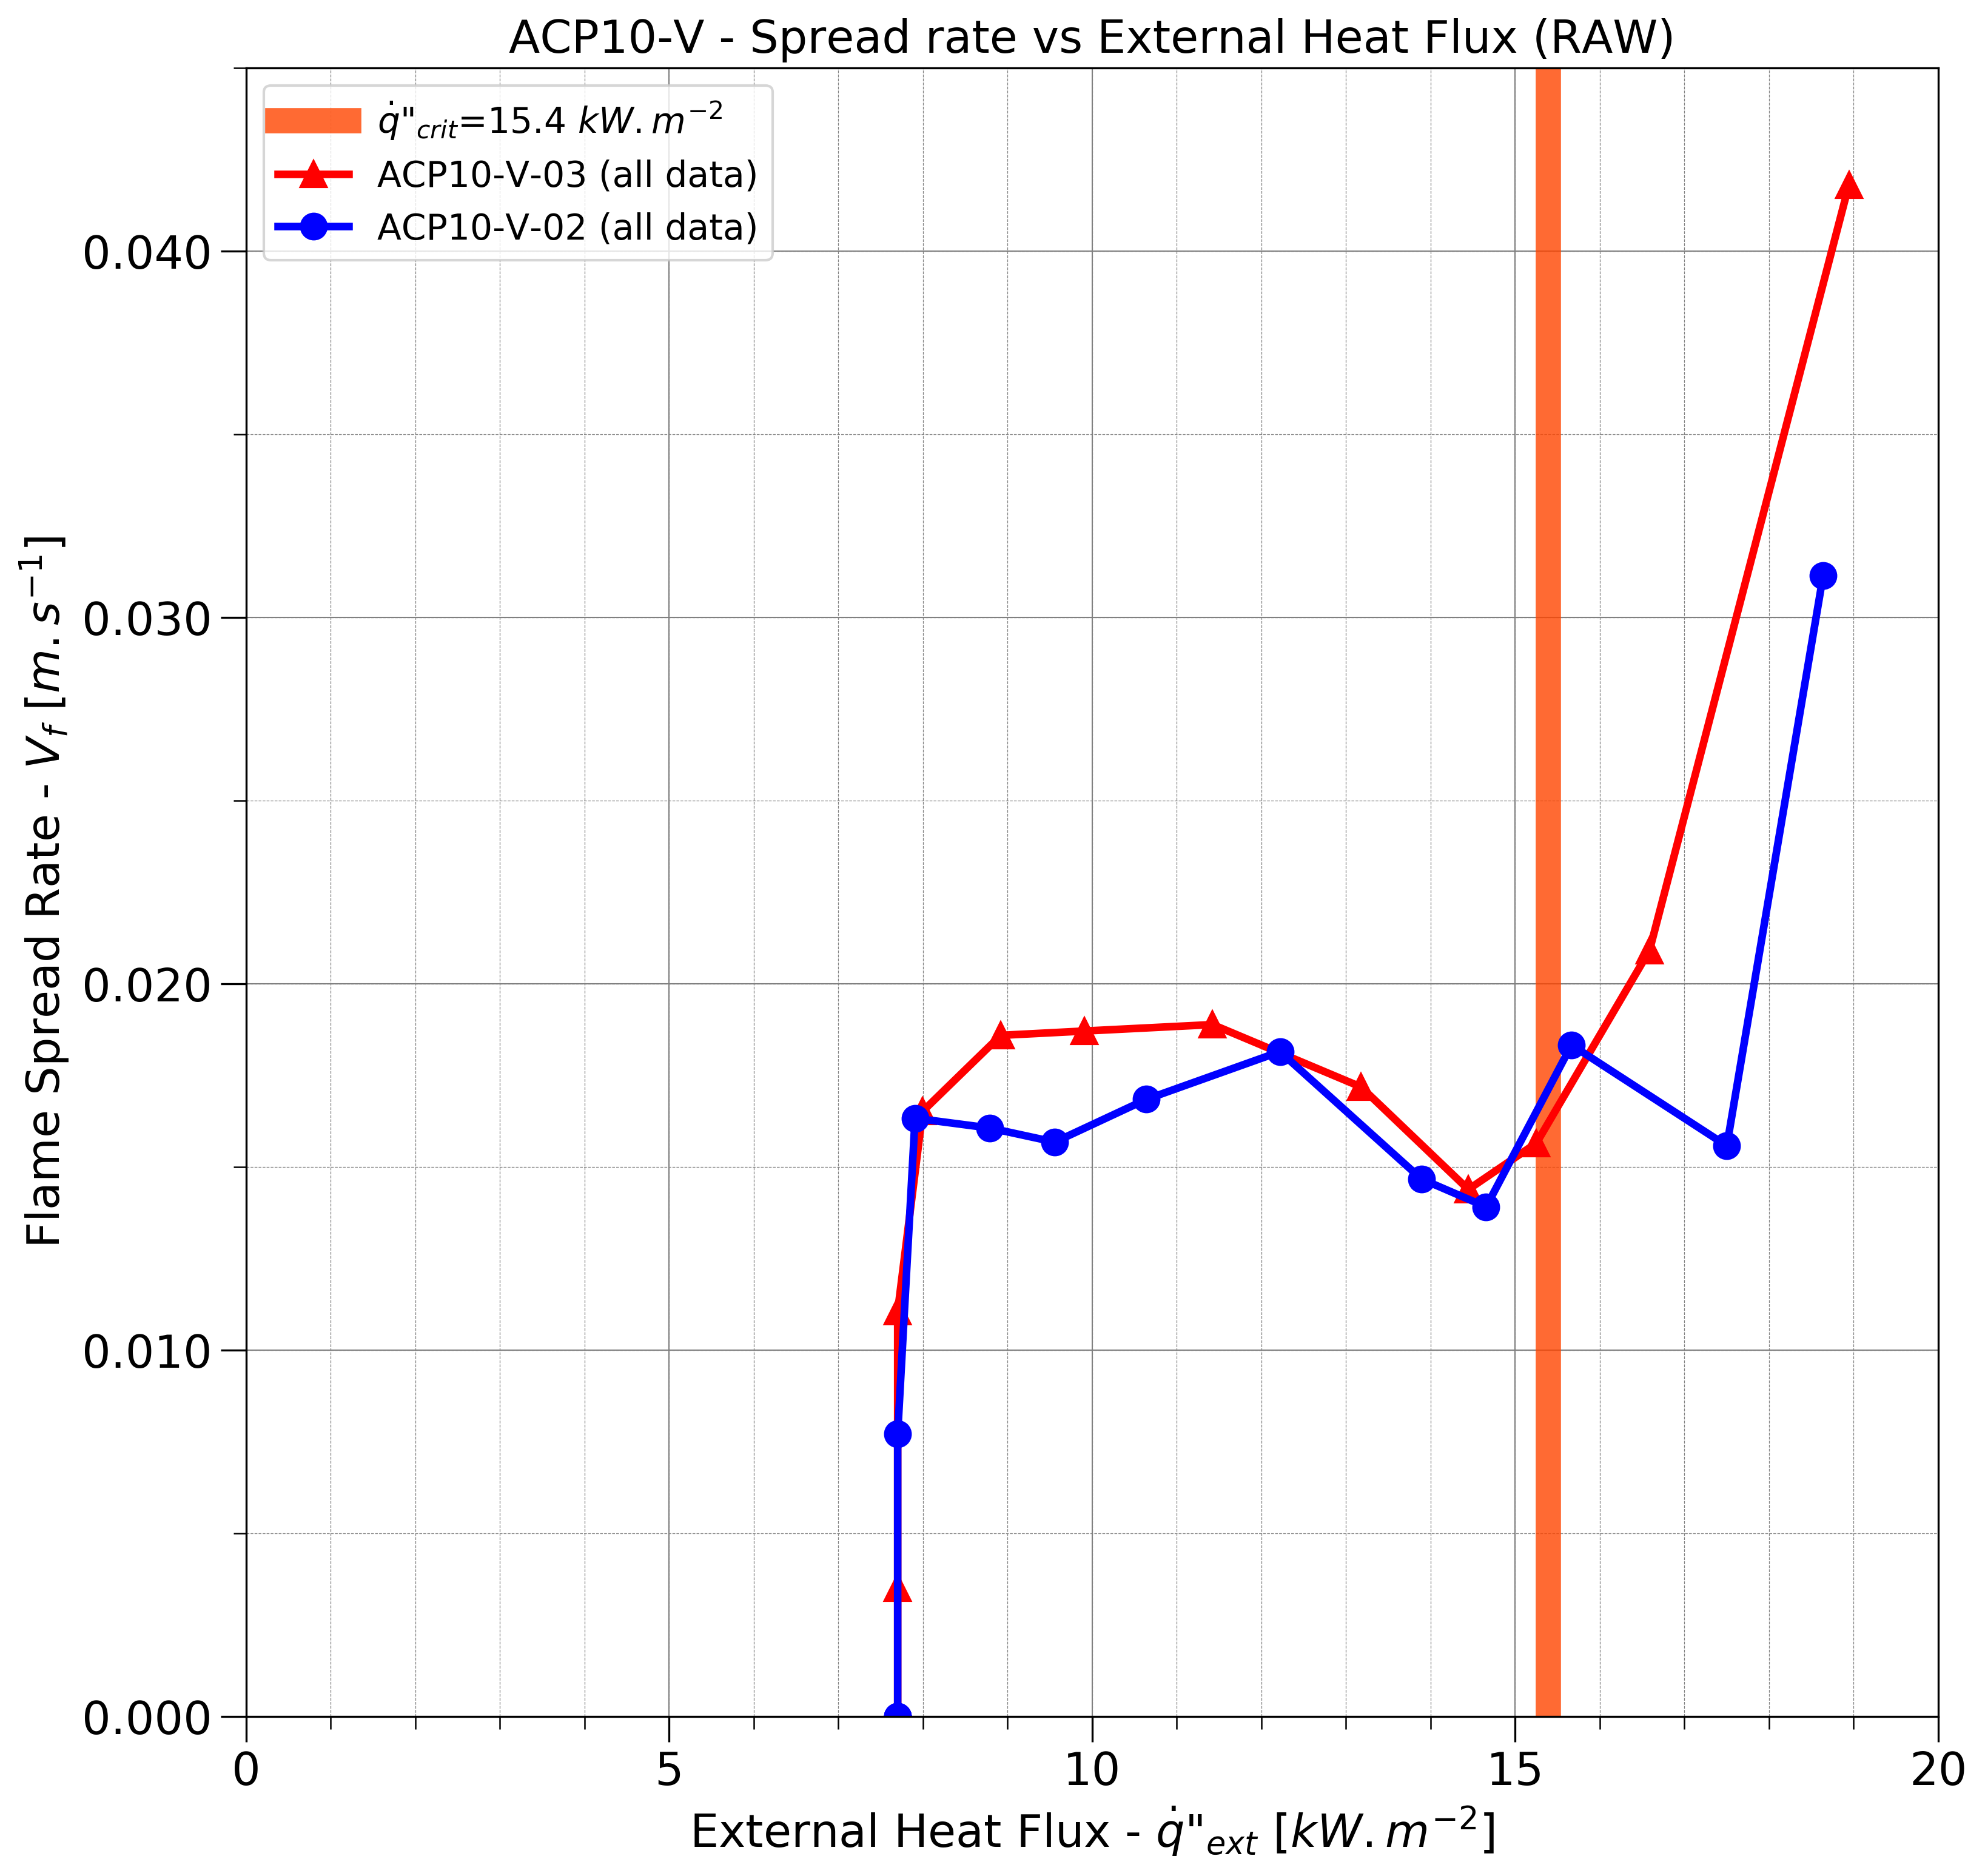
Figure 10. Vertical flame spread rate versus heat flux.
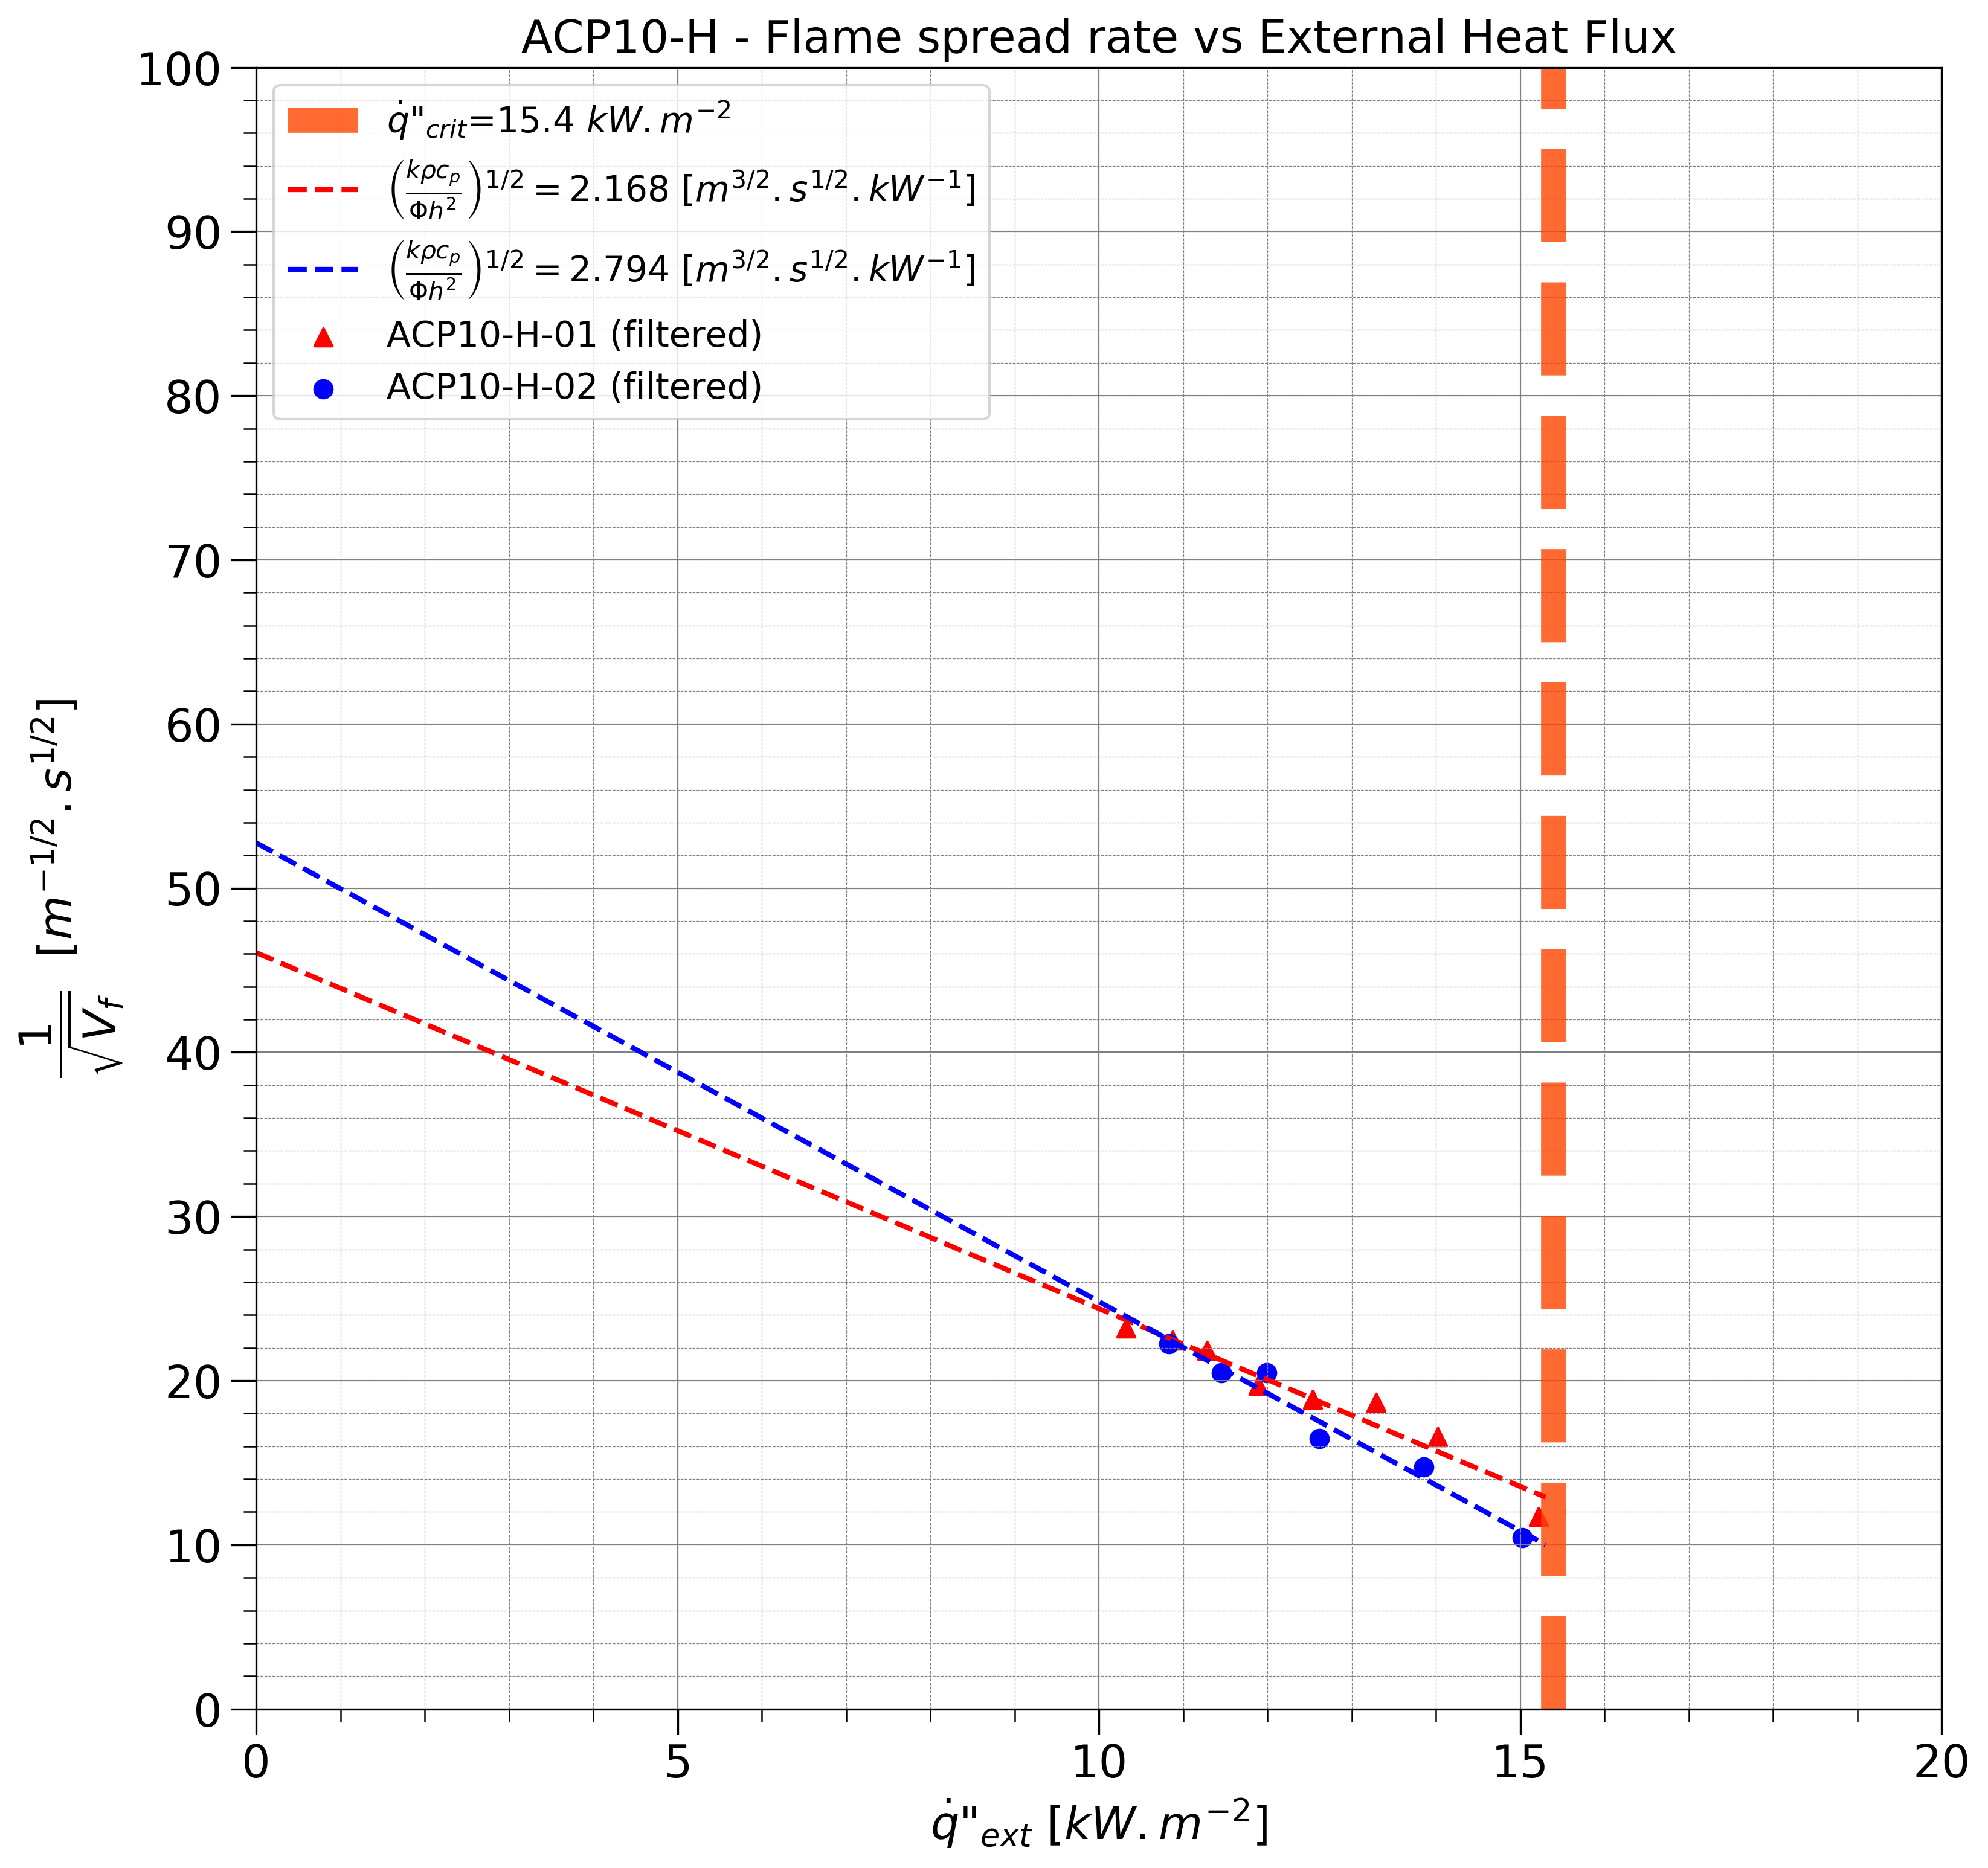
Figure 11. Vf-1/2 as function of q̇″ext in horizontal configuration.

Figure 12. Vf-1/2 as function of q̇″ext in vertical configuration.
Table 12. Flame spread parameter results for sample.
| Orientation | Trial | (kρcp⁄Φh2)1⁄2 [m3⁄2 s1⁄2 kW-1] | Φ [kW2 m-3] |
|---|---|---|---|
| Horizontal | 1 | 2.168 | 66.53 |
| Horizontal | 2 | 2.794 | 39.43 |
| Vertical | 1 | - | 1000 |
| Vertical | 2 | - | 1000 |