ACP01
Material description
Material ID: ACP01
Material type: Aluminium composite panel with a predominantly inorganic core.
Polymer: Ethylene-vinyl acetate (7%)
Additives (fire retardants, fillers or traces of inorganic elements): Calcium Carbonate (51%), Alumina Trihydrate (20%), Magnesium Hydroxide (13%), Silicon Oxide (8%), Sulfur (1%), traces of other elements (<1%)
Core thickness: 2.81mm
Thickness of single metal skin: 0.82mm
| Compound | Mass Concentration (%) |
|---|---|
| Ethylene-vinyl acetate (EVA) | 7 |
| Calcium Carbonate (CaCO3) | 51 |
| Alumina Trihydrate (Al(OH)3) | 20 |
| Magnesium Hydroxide (Mg(OH)2) | 13 |
| Silicon Oxide (SiO2) | 8 |
| Sulfur (S) | 1 |
| Traces of sodium (Na) | <1 |
| Traces of potassium (K) | <1 |
| Traces of iron (Fe) | <1 |
| Traces of scandium (Sc) | <1 |
A. Material composition identification
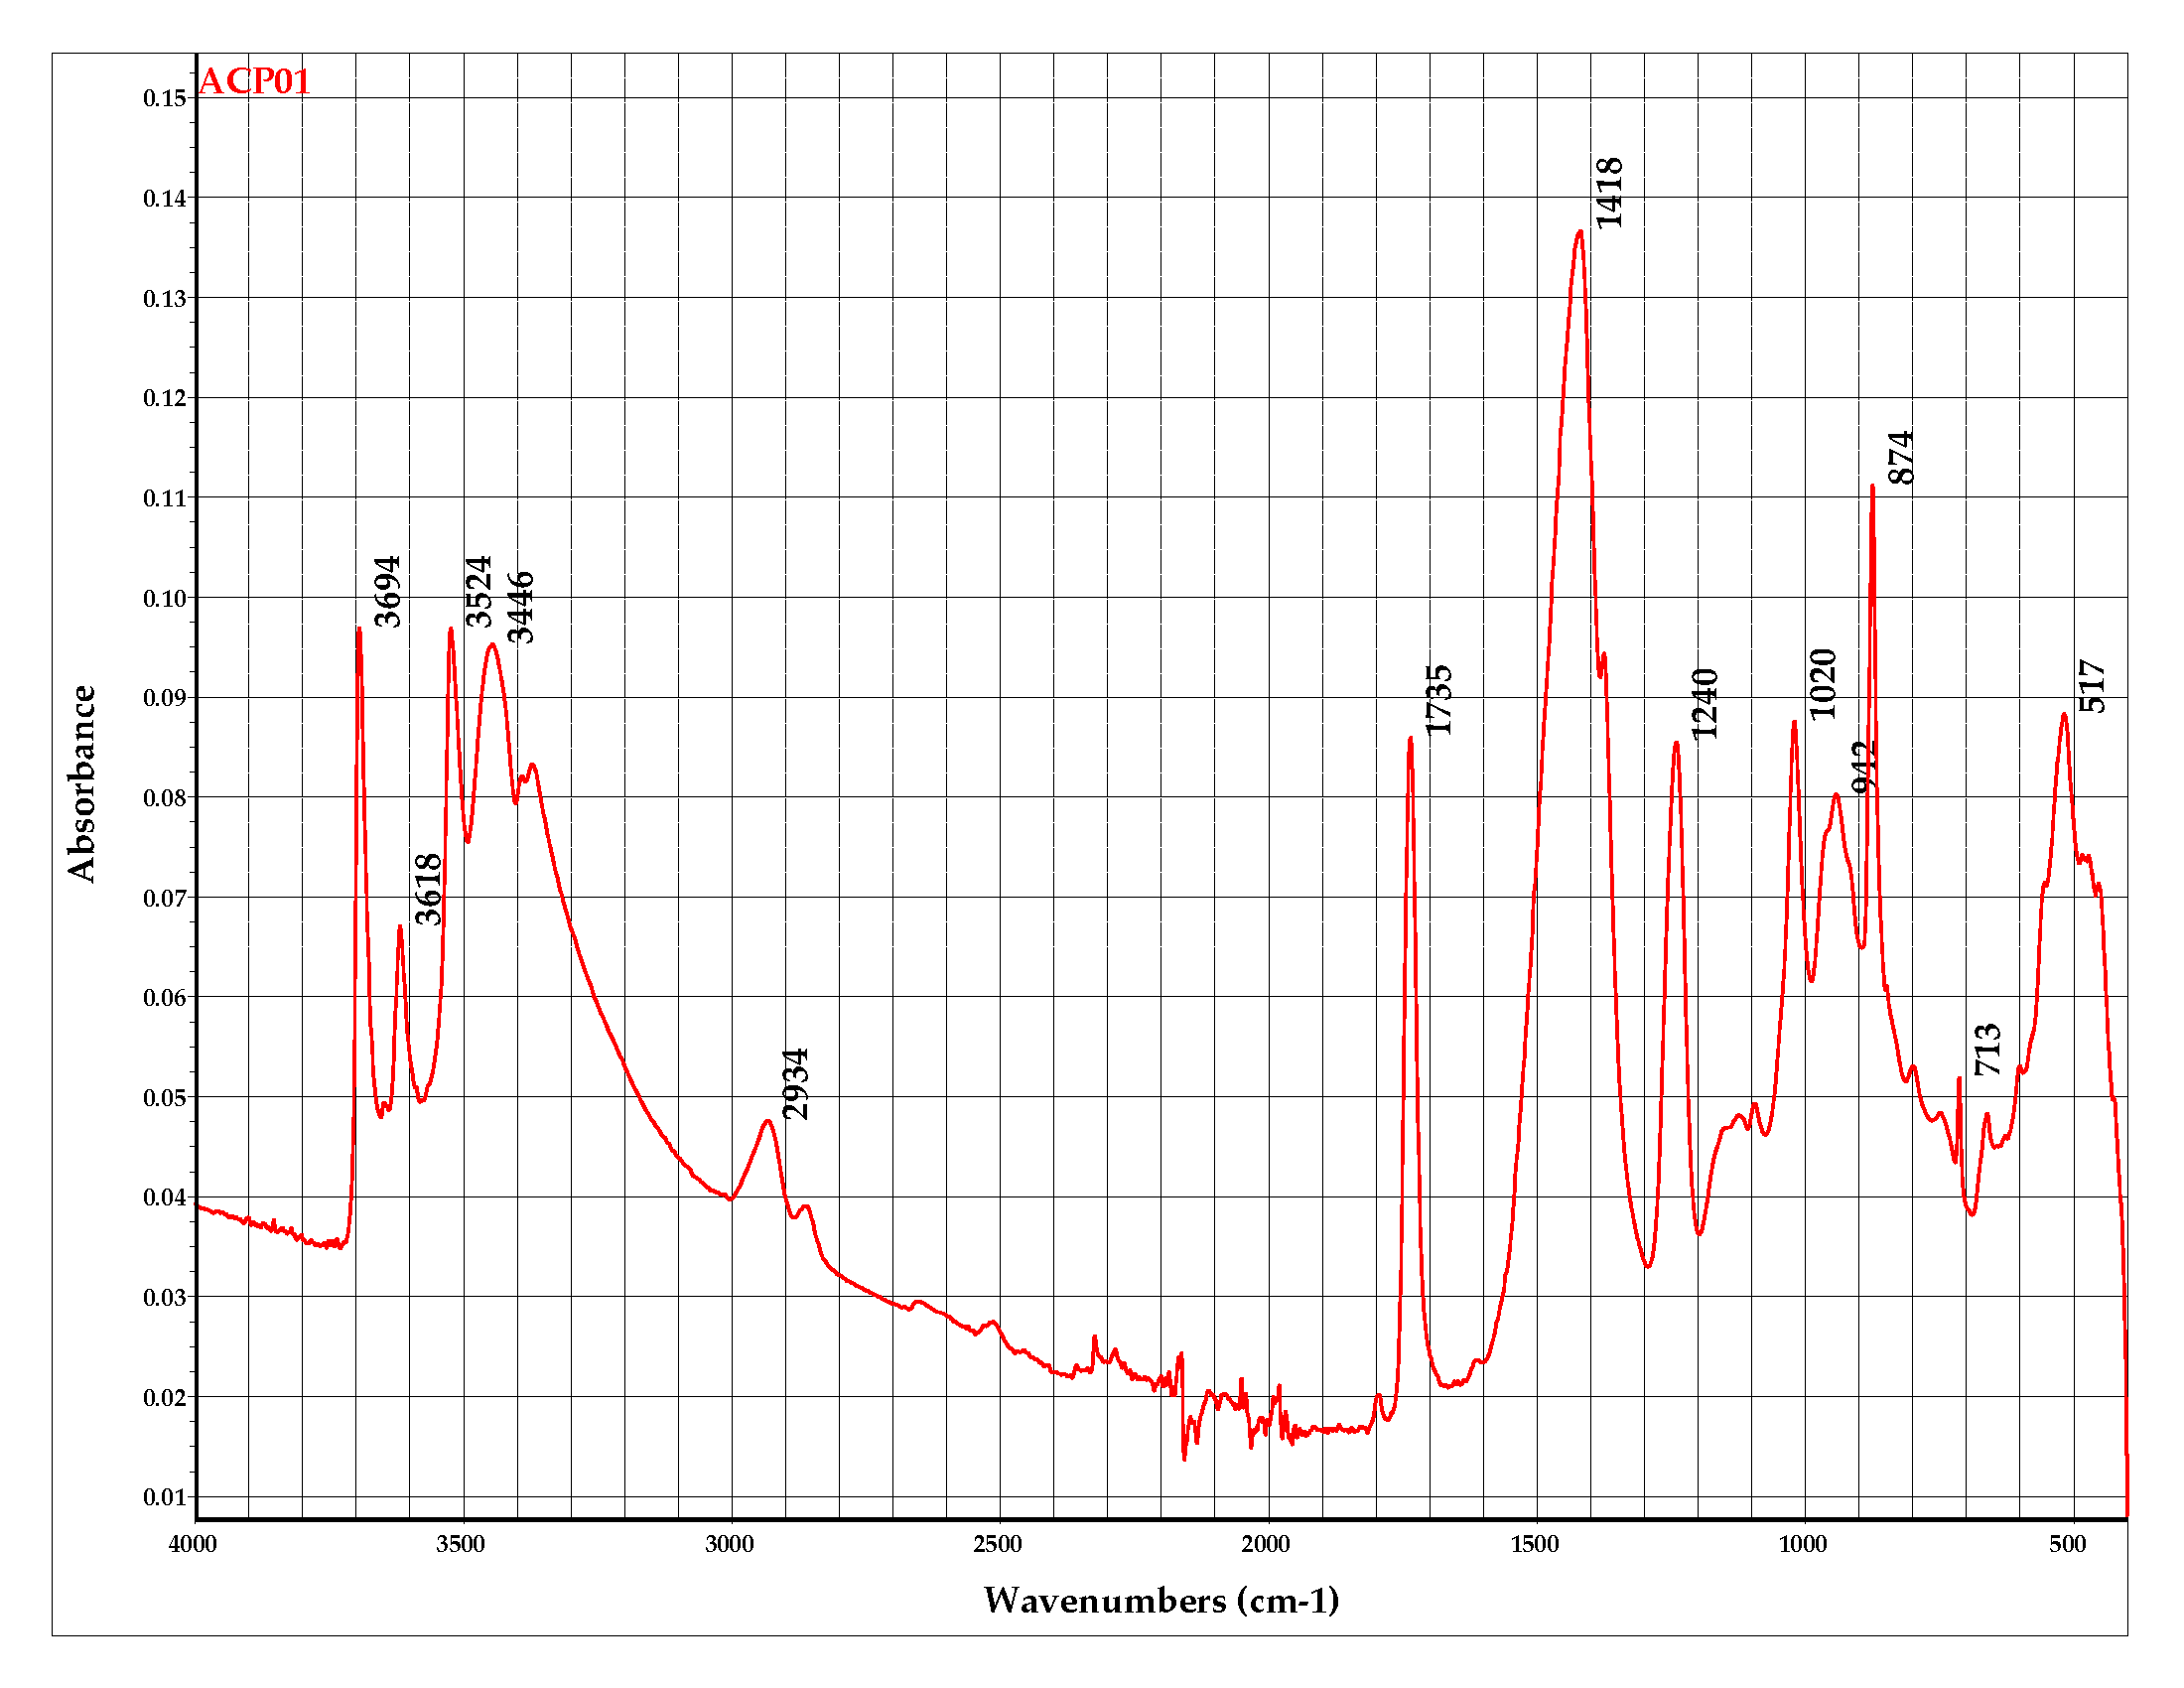
A.1 Attenuated total reflection – Fourier transform infrared spectroscopy (ATR-FTIR)
Table 2. FTIR compound identification.| Identified Compounds |
|---|
| Ethylene-vinyl acetate (EVA) |
| Calcium Carbonate (CaCO3) |
| Alumina Trihydrate (Al(OH)3) |
| Magnesium Hydroxide (Mg(OH)2) |
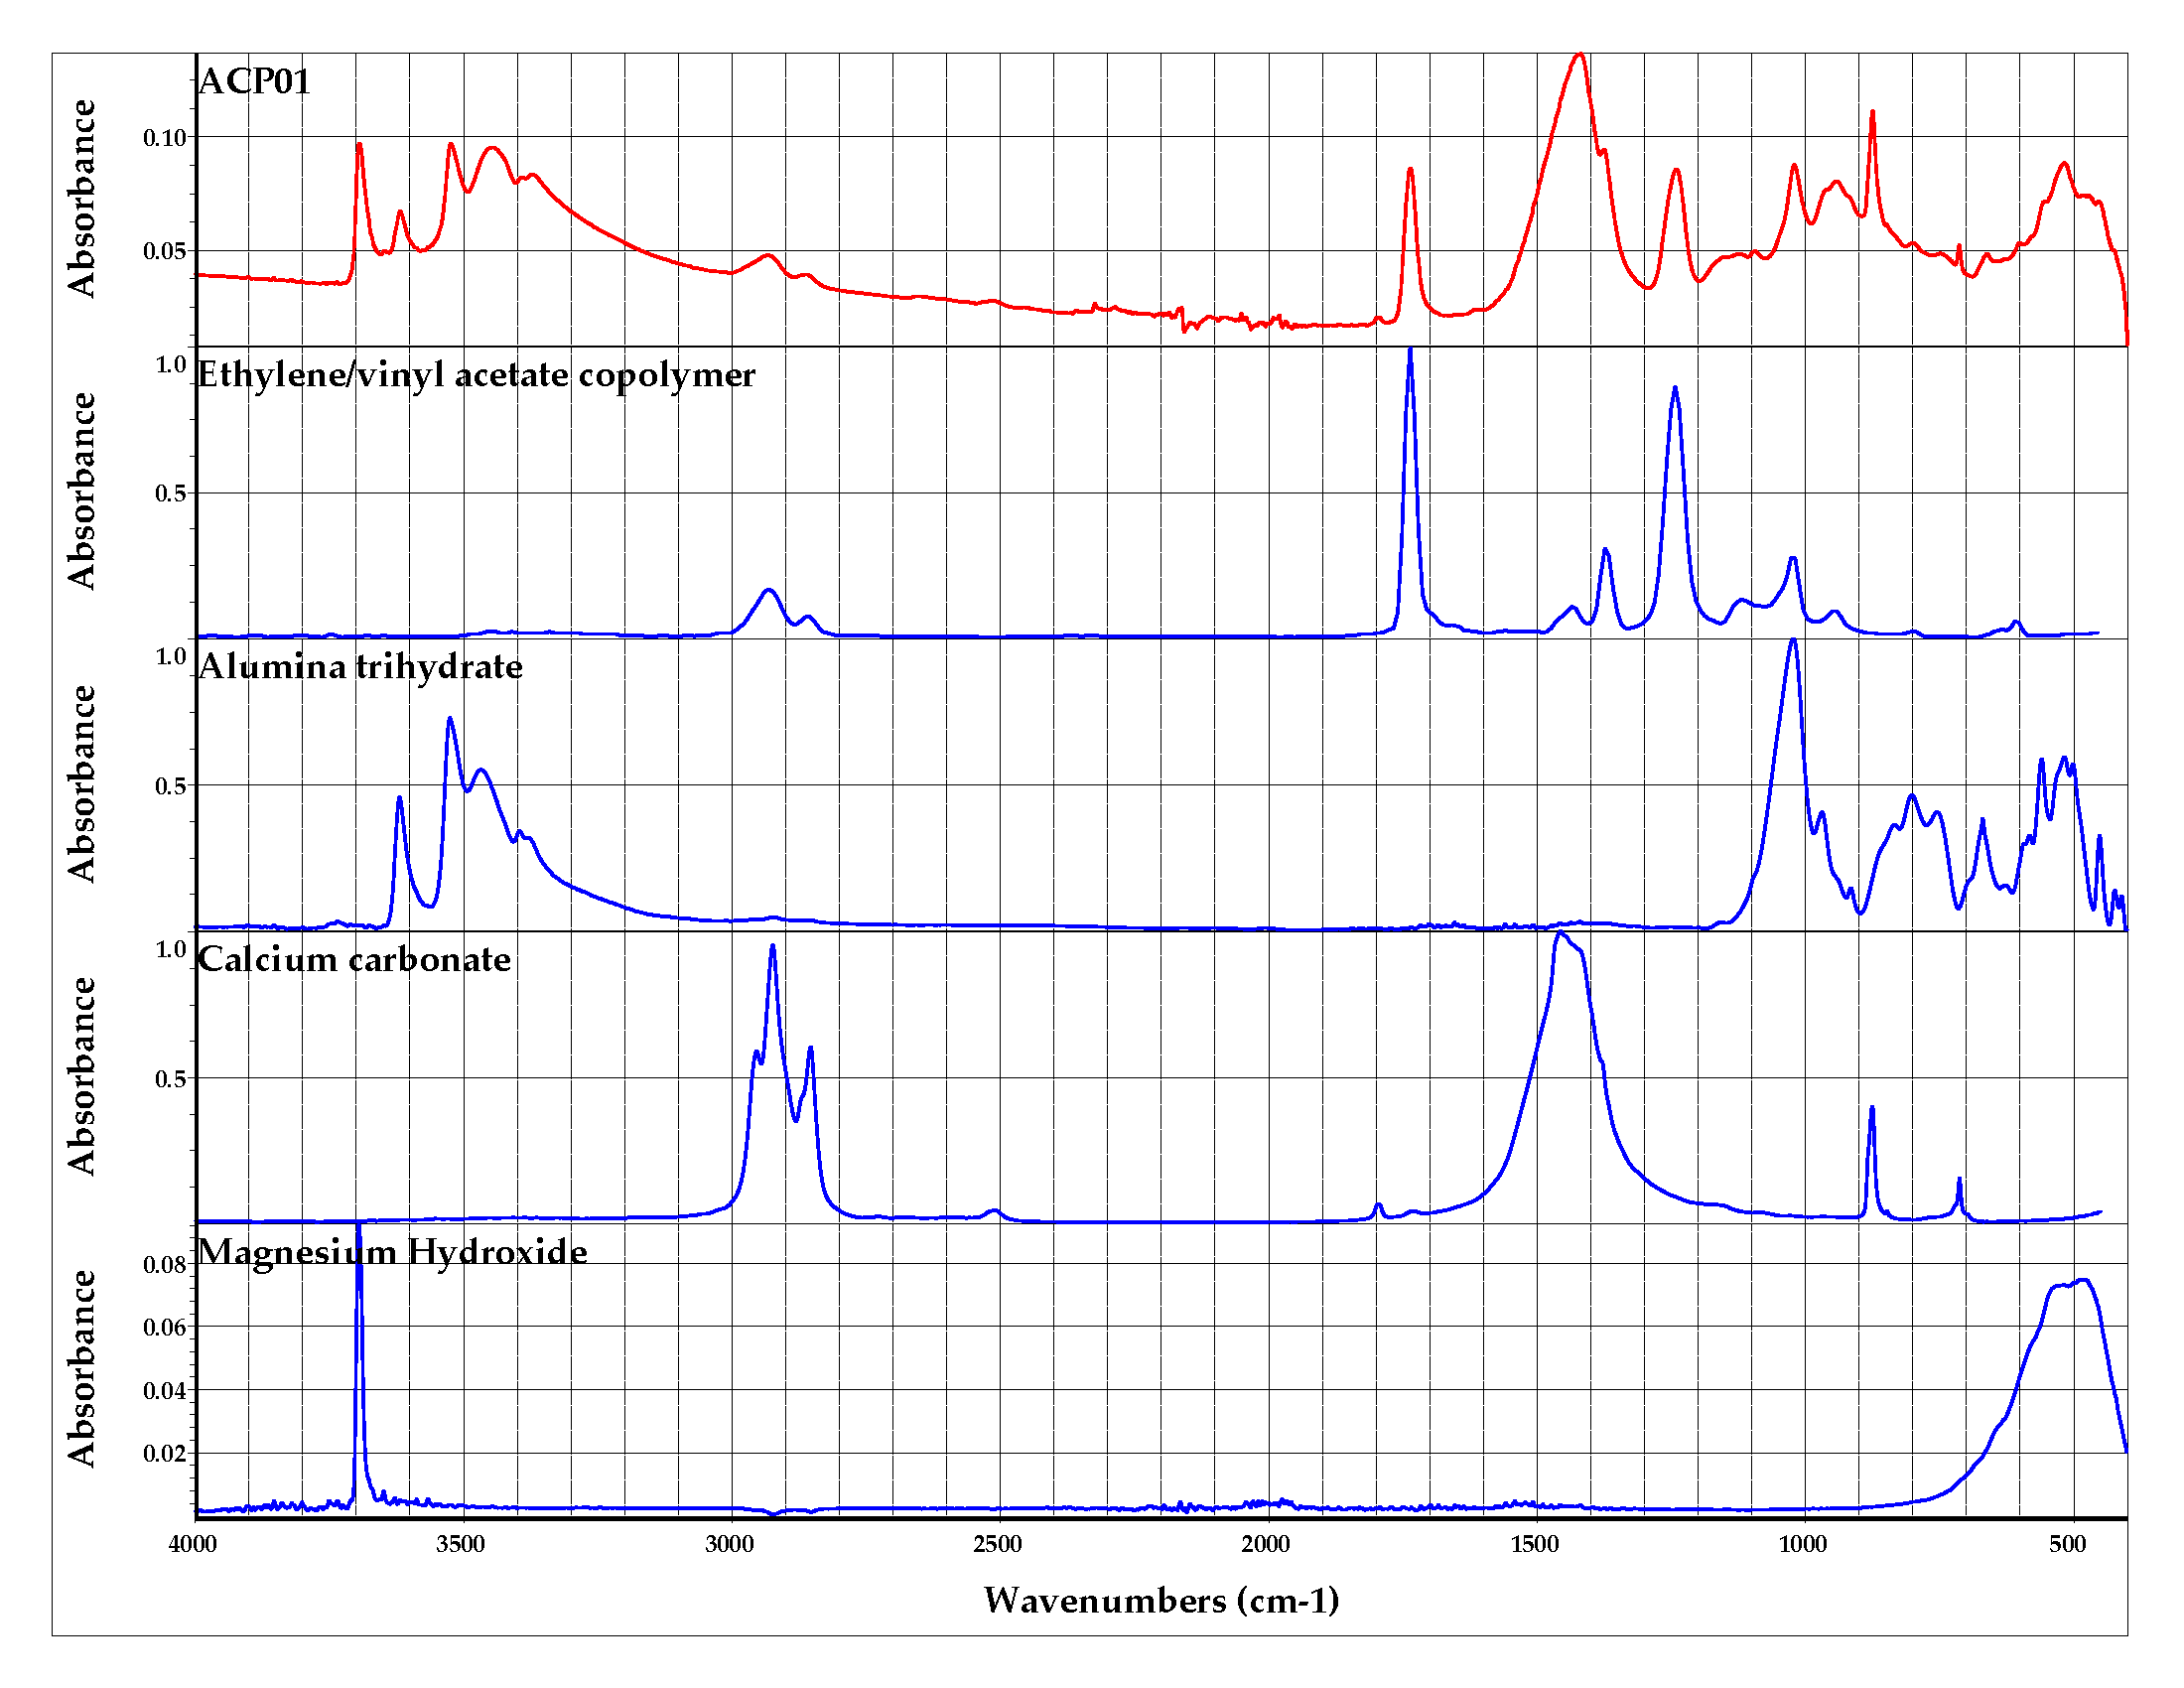
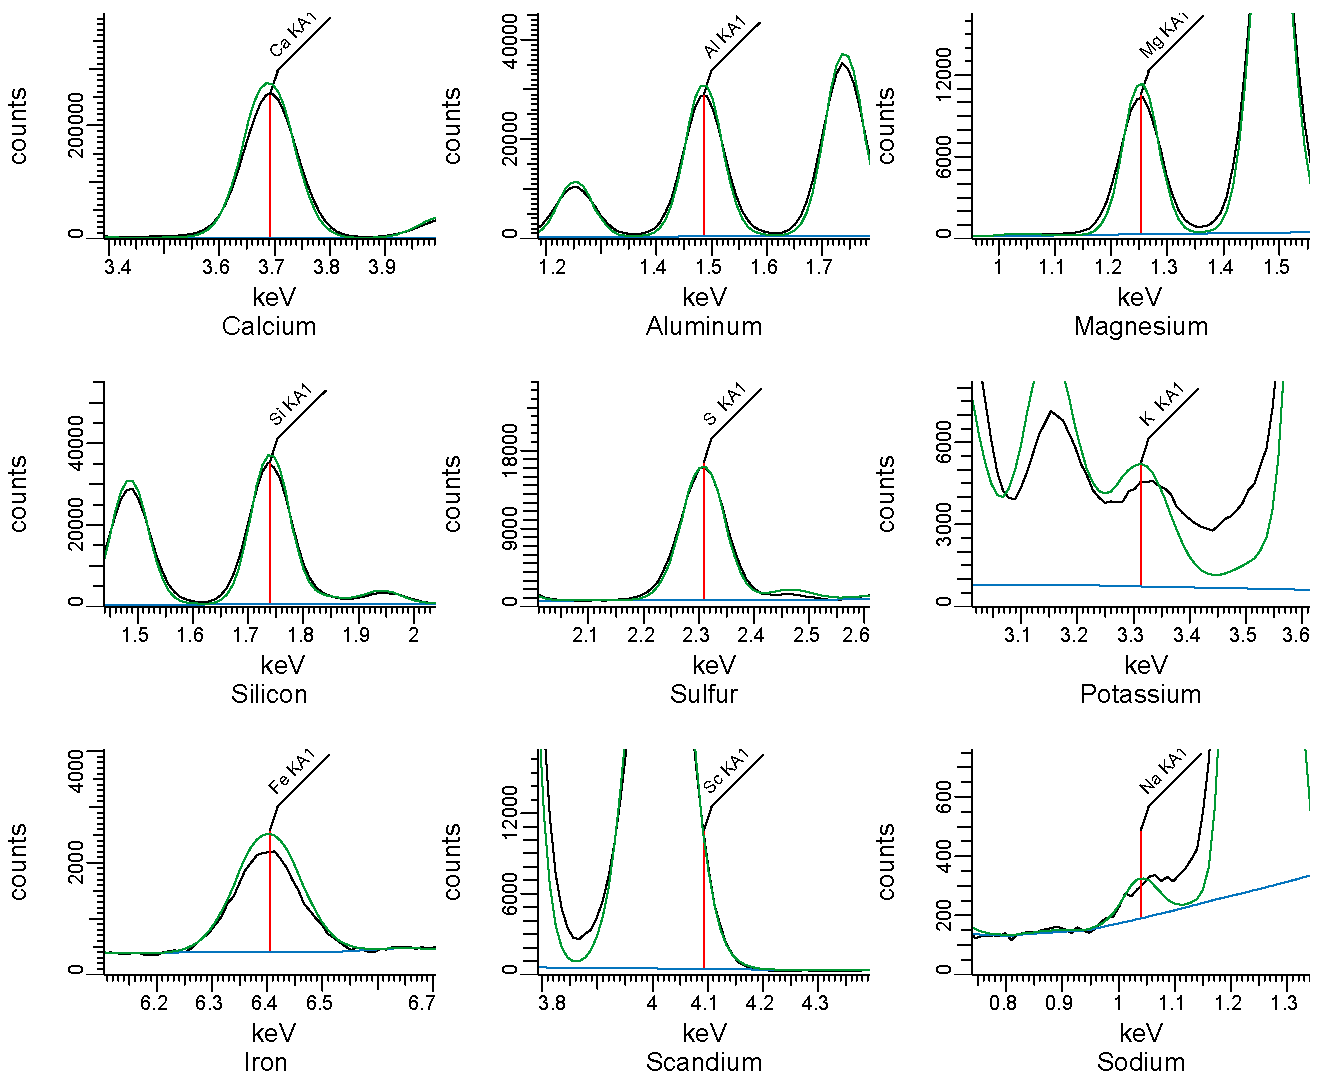
A.2 Energy Dispersive X-Ray Fluorescence (EDXRF)
Table 2. Inorganic elements and their mass concentration identified with EDXRF.| Element | Mass Concentration (%) |
|---|---|
| Ca | 38 |
| Al | 8 |
| Mg | 6 |
| Si | 5 |
| S | 1 |
| Fe | <1 |
| K | <1 |
| Na | <1 |
| Sc | <1 |
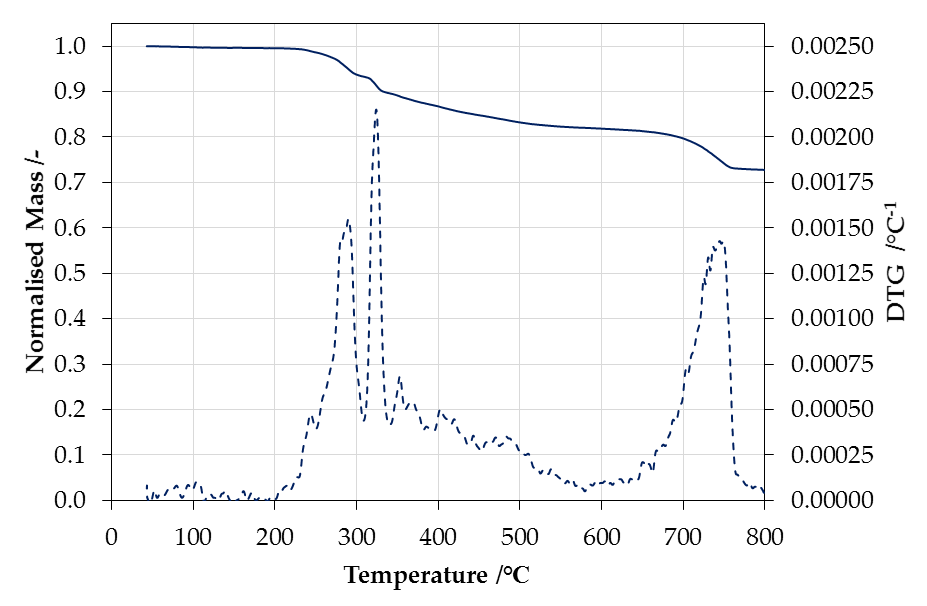
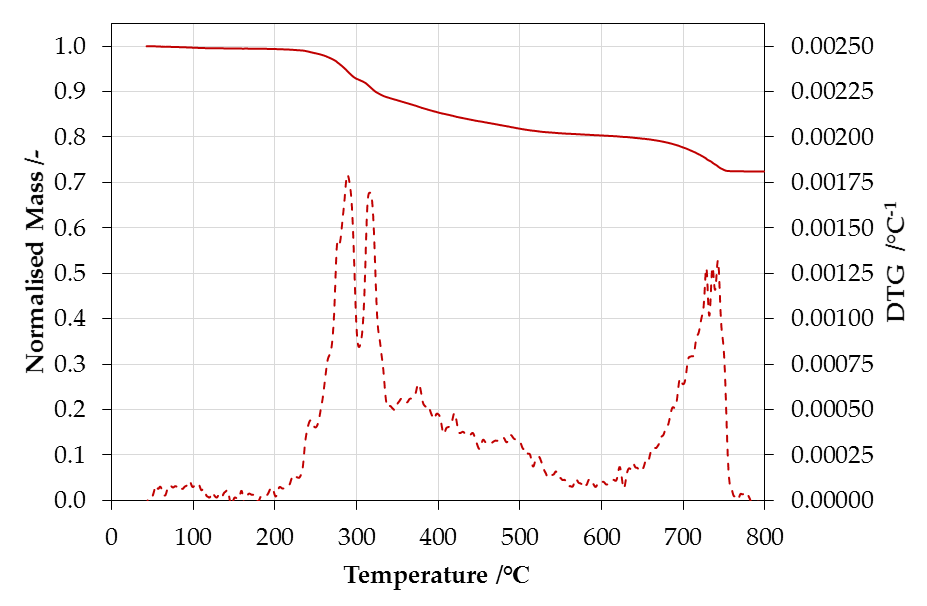
B. Thermogravimetric analysis
Table 3. Mass fraction of residue after thermal decomposition.| Condition | Fraction of mass residue at 800°C |
|---|---|
| Non-oxidative (nitrogen) | 0.73 |
| Oxidative (air) | 0.72 |
| Peak ID | Temperature peak (°C) | Amplitude of peak (°C-1) |
|---|---|---|
| Peak 1 | 290 | 1.55 x 10⁻³ |
| Peak 2 | 324 | 2.15 x 10⁻³ |
| Peak 3 | 744 | 1.43 x 10⁻³ |
| Peak ID | Temperature peak (°C) | Amplitude of peak (°C-1) |
|---|---|---|
| Peak 1 | 289 | 1.8 x 10⁻³ |
| Peak 2 | 316 | 1.7 x 10⁻³ |
| Peak 3 | 742 | 1.32 x 10⁻³ |
C. Gross Heat of Combustion
Table 7. Gross Heat of Combustion individual results for sample.| Trial | ΔHc [kJ g-1] |
|---|---|
| Trial 1 | 2.60 |
| Trial 2 | 2.23 |
| Trial 3 | 2.28 |
| Average | 2.37 |
| Std dev | 0.20 |
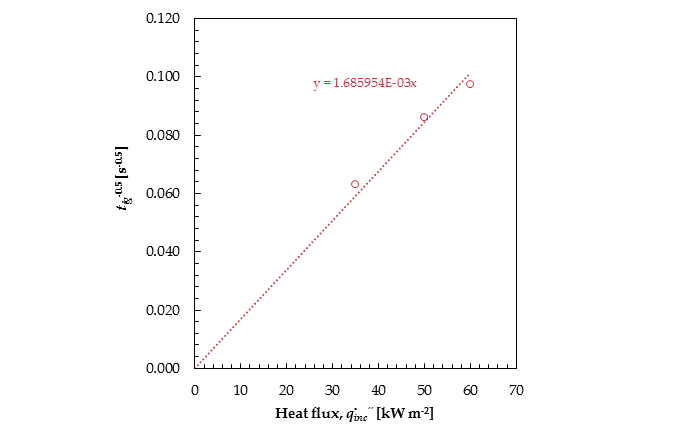
D. Ignition parameters
Table 8. Summary of ignition parameters for sample.| Critical heat flux for ignition | Ignition temperature | Total heat transfer coefficient of losses | Apparent thermal inertia |
|---|---|---|---|
| q̇″cr [kW m−2] | Tig [°C] | hr [W m-2 K-1] | kρc [kW2 m-4 K-2 s] |
| 32.70 | 539 | 56.70 | 1.348 |
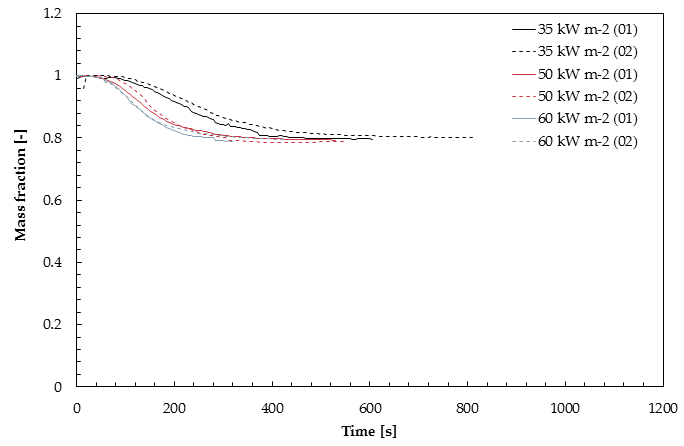
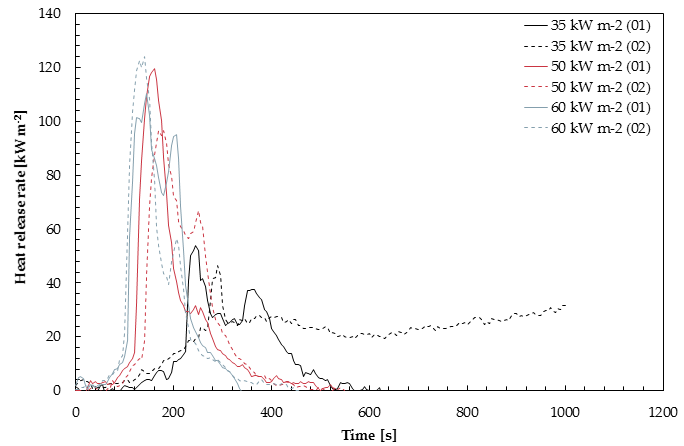
E. Burning behaviour
Table 9. Summary of key burning behaviour metrics.| Heat flux | Test | Time to ignition | Fraction of mass residue | Peak heat release rate | Total energy released |
|---|---|---|---|---|---|
| q̇″inc [kW m-2] | tig [s] | mres [-] | q̇″p [kW m-2] | Qt [MJ m-2] | |
| 35 kW m-2 | |||||
| Test 1 | 229 | 0.74 | 53.87 | 7.19 | |
| Test 2 | 275 | 0.80 | 46.42 | 18.49 | |
| Avg | 252 | 0.77 | 50.15 | 12.84 | |
| 50 kW m-2 | |||||
| Test 1 | 127 | 0.79 | 120.32 | 10.61 | |
| Test 2 | 143 | 0.78 | 98.96 | 11.09 | |
| Avg | 135 | 0.79 | 109.64 | 10.85 | |
| 60 kW m-2 | |||||
| Test 1 | 106 | 0.79 | 110.46 | 11.59 | |
| Test 2 | 105 | 0.80 | 129.48 | 10.68 | |
| Avg | 106 | 0.79 | 119.97 | 11.14 | |
| 80 kW m-2 | |||||
| Test 1 | - | - | - | - | |
| Test 2 | - | - | - | - | |
| Avg | - | - | - | - |
| Test | ΔHc [kJ g-1] |
|---|---|
| 35 kW m-2 (Test 1) | 5.36 |
| 35 kW m-2 (Test 2) | 16.40 |
| 50 kW m-2 (Test 1) | 9.31 |
| 50 kW m-2 (Test 2) | 9.40 |
| 60 kW m-2 (Test 1) | 9.97 |
| 60 kW m-2 (Test 2) | 8.83 |
| 80 kW m-2 (Test 1) | - |
| 80 kW m-2 (Test 2) | - |
| Average | 9.88 |
| Std dev | 3.59 |
F. Flame Spread
Table 11. Minimum heat flux for flame spread rate and minimum flame spread rate for sample.| Orientation | q̇″min.spread [kW m-2] | Vf.min [mm s-1] |
|---|---|---|
| Horizontal | 100 | - |
| Vertical | 100 | - |
| Orientation | Trial | (kρcp⁄Φh2)1⁄2 [m3⁄2 s1⁄2 kW-1] | Φ [kW2 m-3] |
|---|---|---|---|
| Horizontal | 1 | 100 | - |
| Horizontal | 2 | 100 | - |
| Vertical | 1 | 100 | - |
| Vertical | 2 | 100 | - |
Localised ignition occurs but there is no spread of flame on the surface below the critical heat flux for ignition.