
ACP21
Material description
Material ID: ACP21
Material type: Aluminium composite panel with a core consisting of polyethylene (PE) and an inorganic filler.
Polymer: Polyethylene (66%)
Additives (fire retardants, fillers or traces of inorganic elements): Calcium Carbonate (32%), Silicon (1%), Magnesium (1%), Chlorine (1%), traces of other elements (<1%)
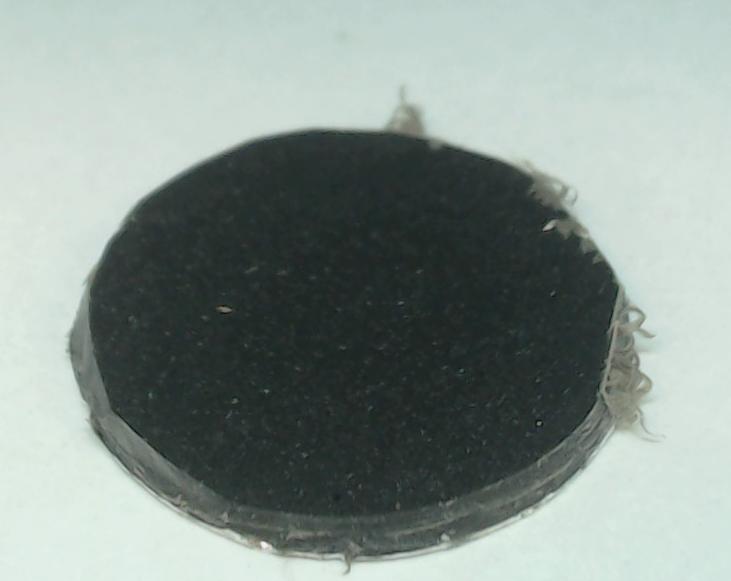
Table 1. Estimated mass concentration of compounds.
| Compound | Mass Concentration (%) |
|---|---|
| Polyethylene (PE) | 66 |
| Calcium Carbonate (CaCO3) | 32 |
| Silicon (Si) | 1 |
| Magnesium (Mg) | 1 |
| Chlorine (Cl) | 1 |
| Traces of aluminium (Al) | <1 |
| Traces of titanium (Ti) | <1 |
| Traces of iron (Fe) | <1 |
| Traces of potassium (K) | <1 |
| Traces of scandium (Sc) | <1 |
A. Material composition identification
A.1 Attenuated total reflection – Fourier transform infrared spectroscopy (ATR-FTIR)
Table 2. FTIR compound identification.| Identified Compounds |
|---|
| Polyethylene (PE) |
| Calcium Carbonate (CaCO3) |
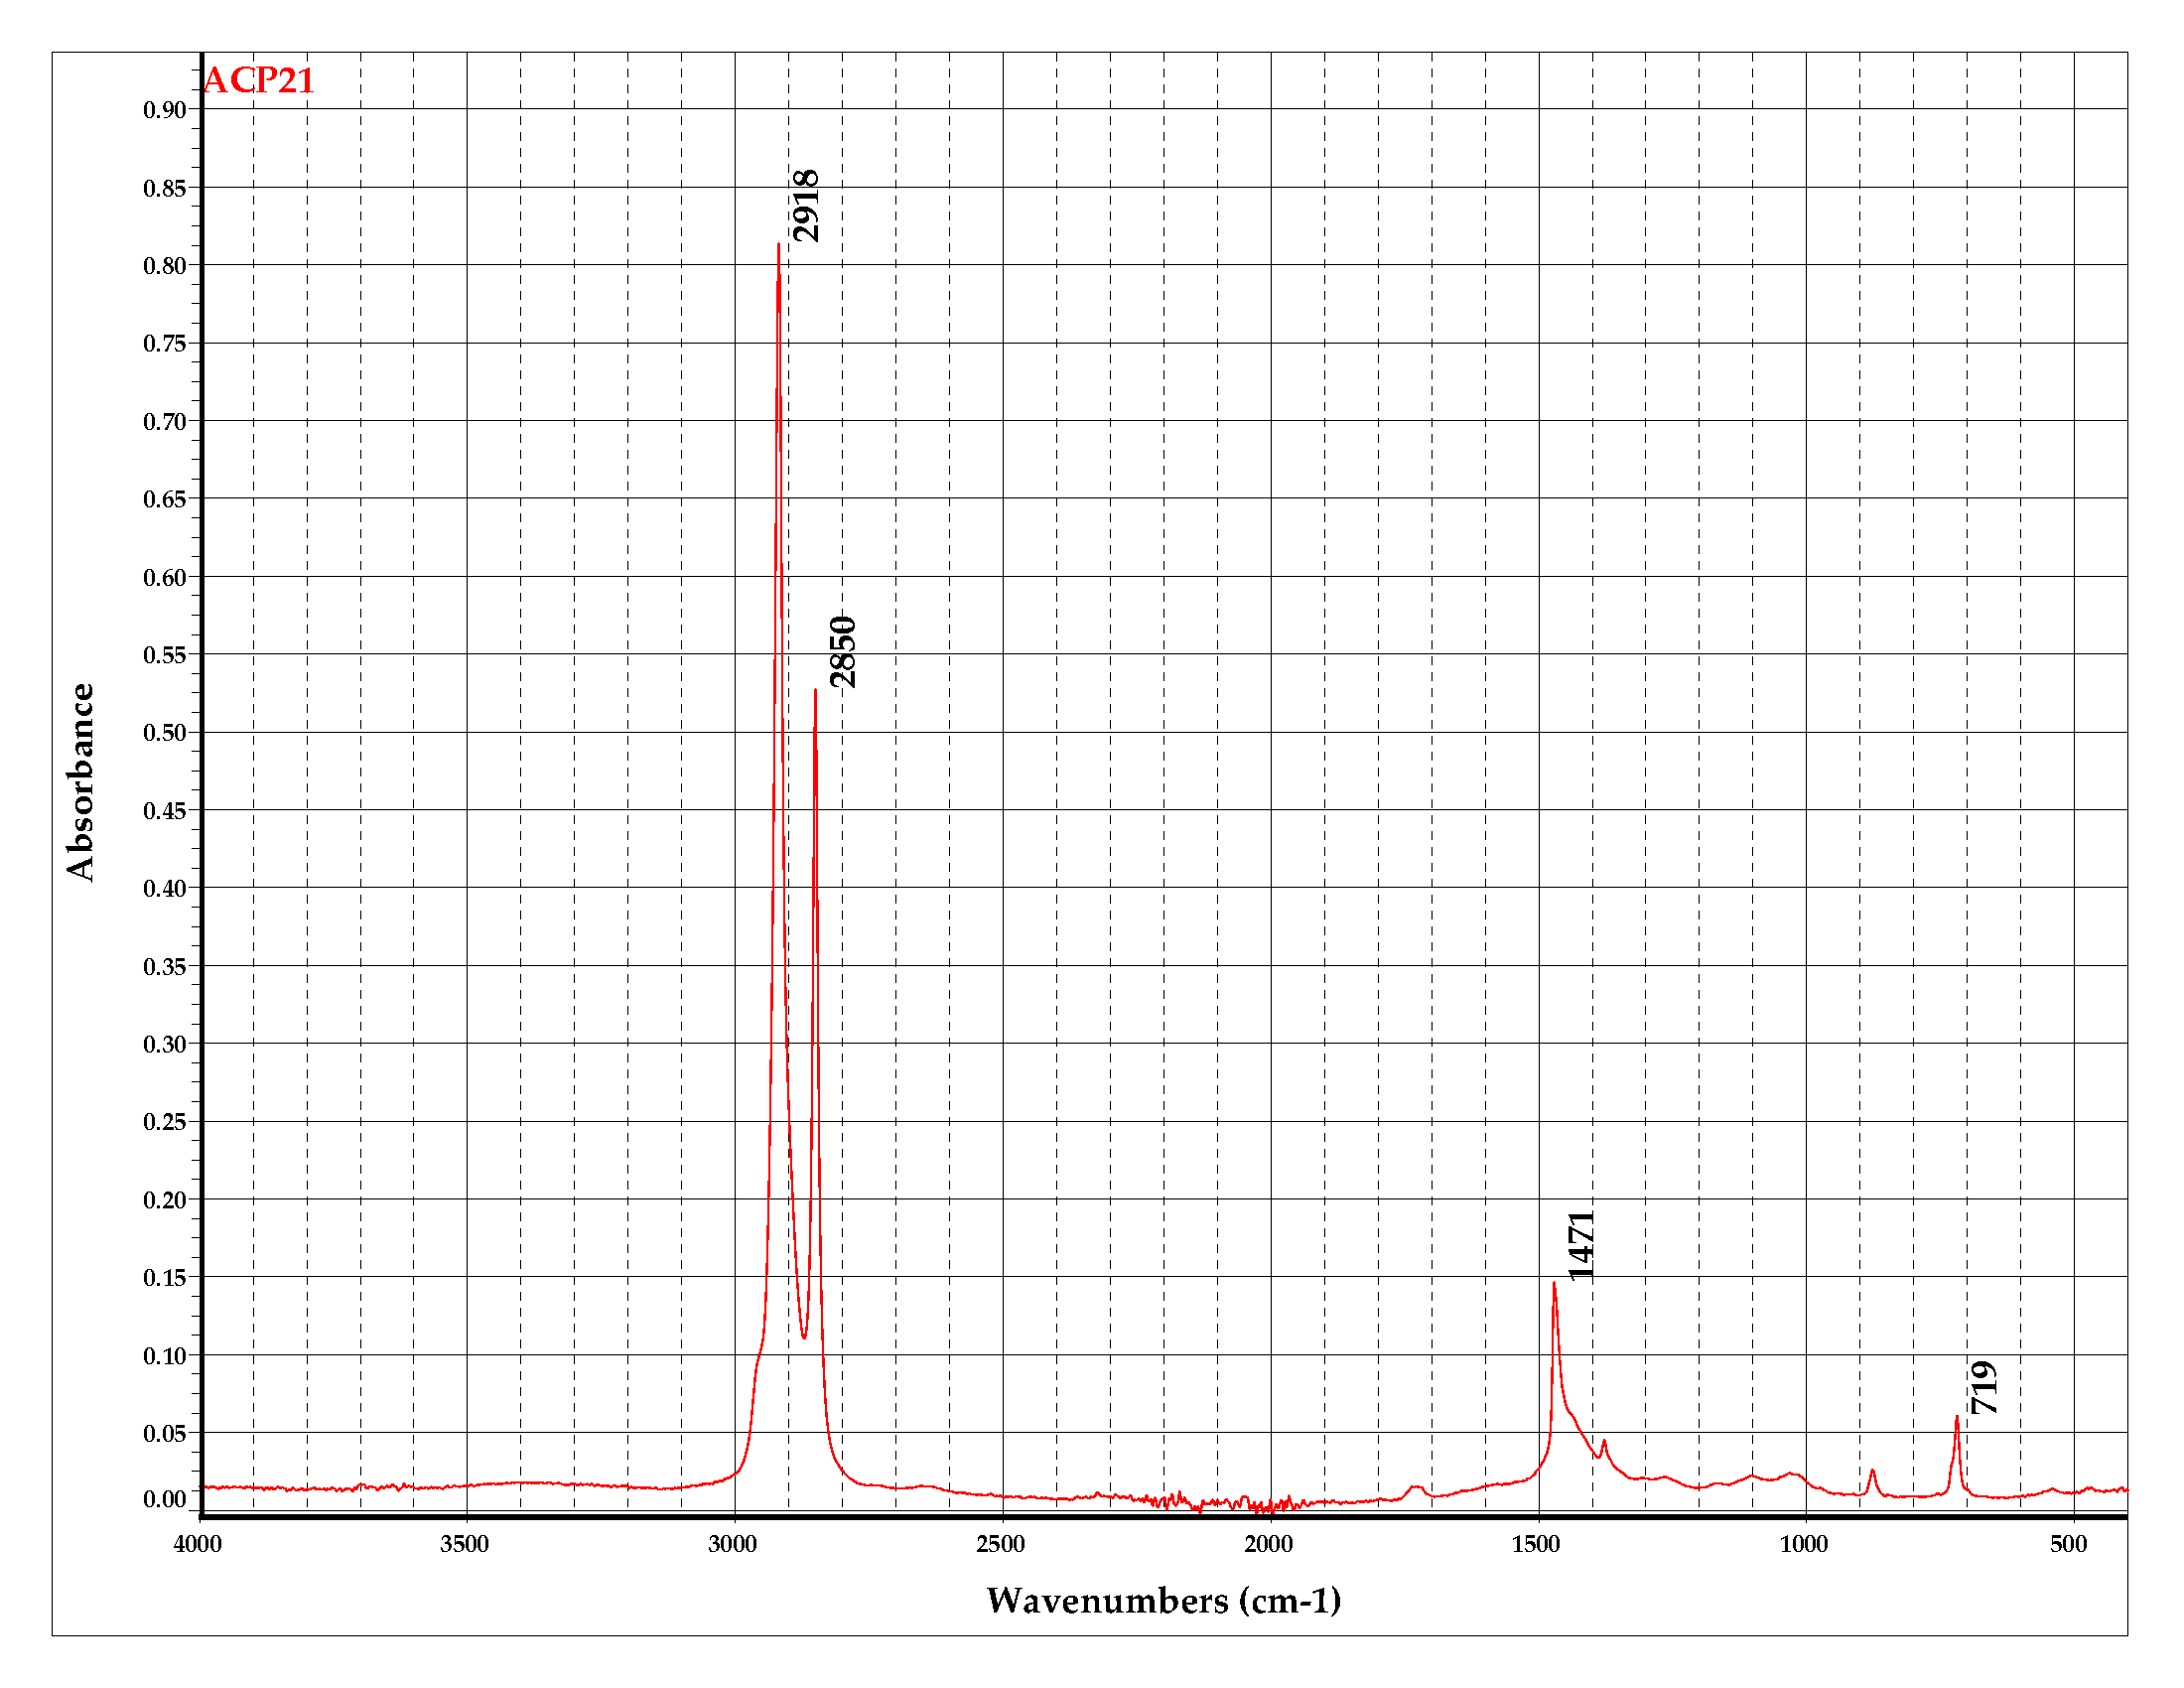
Figure 1 . FTIR spectra: Absorbance percentage versus wavenumber from the sample.
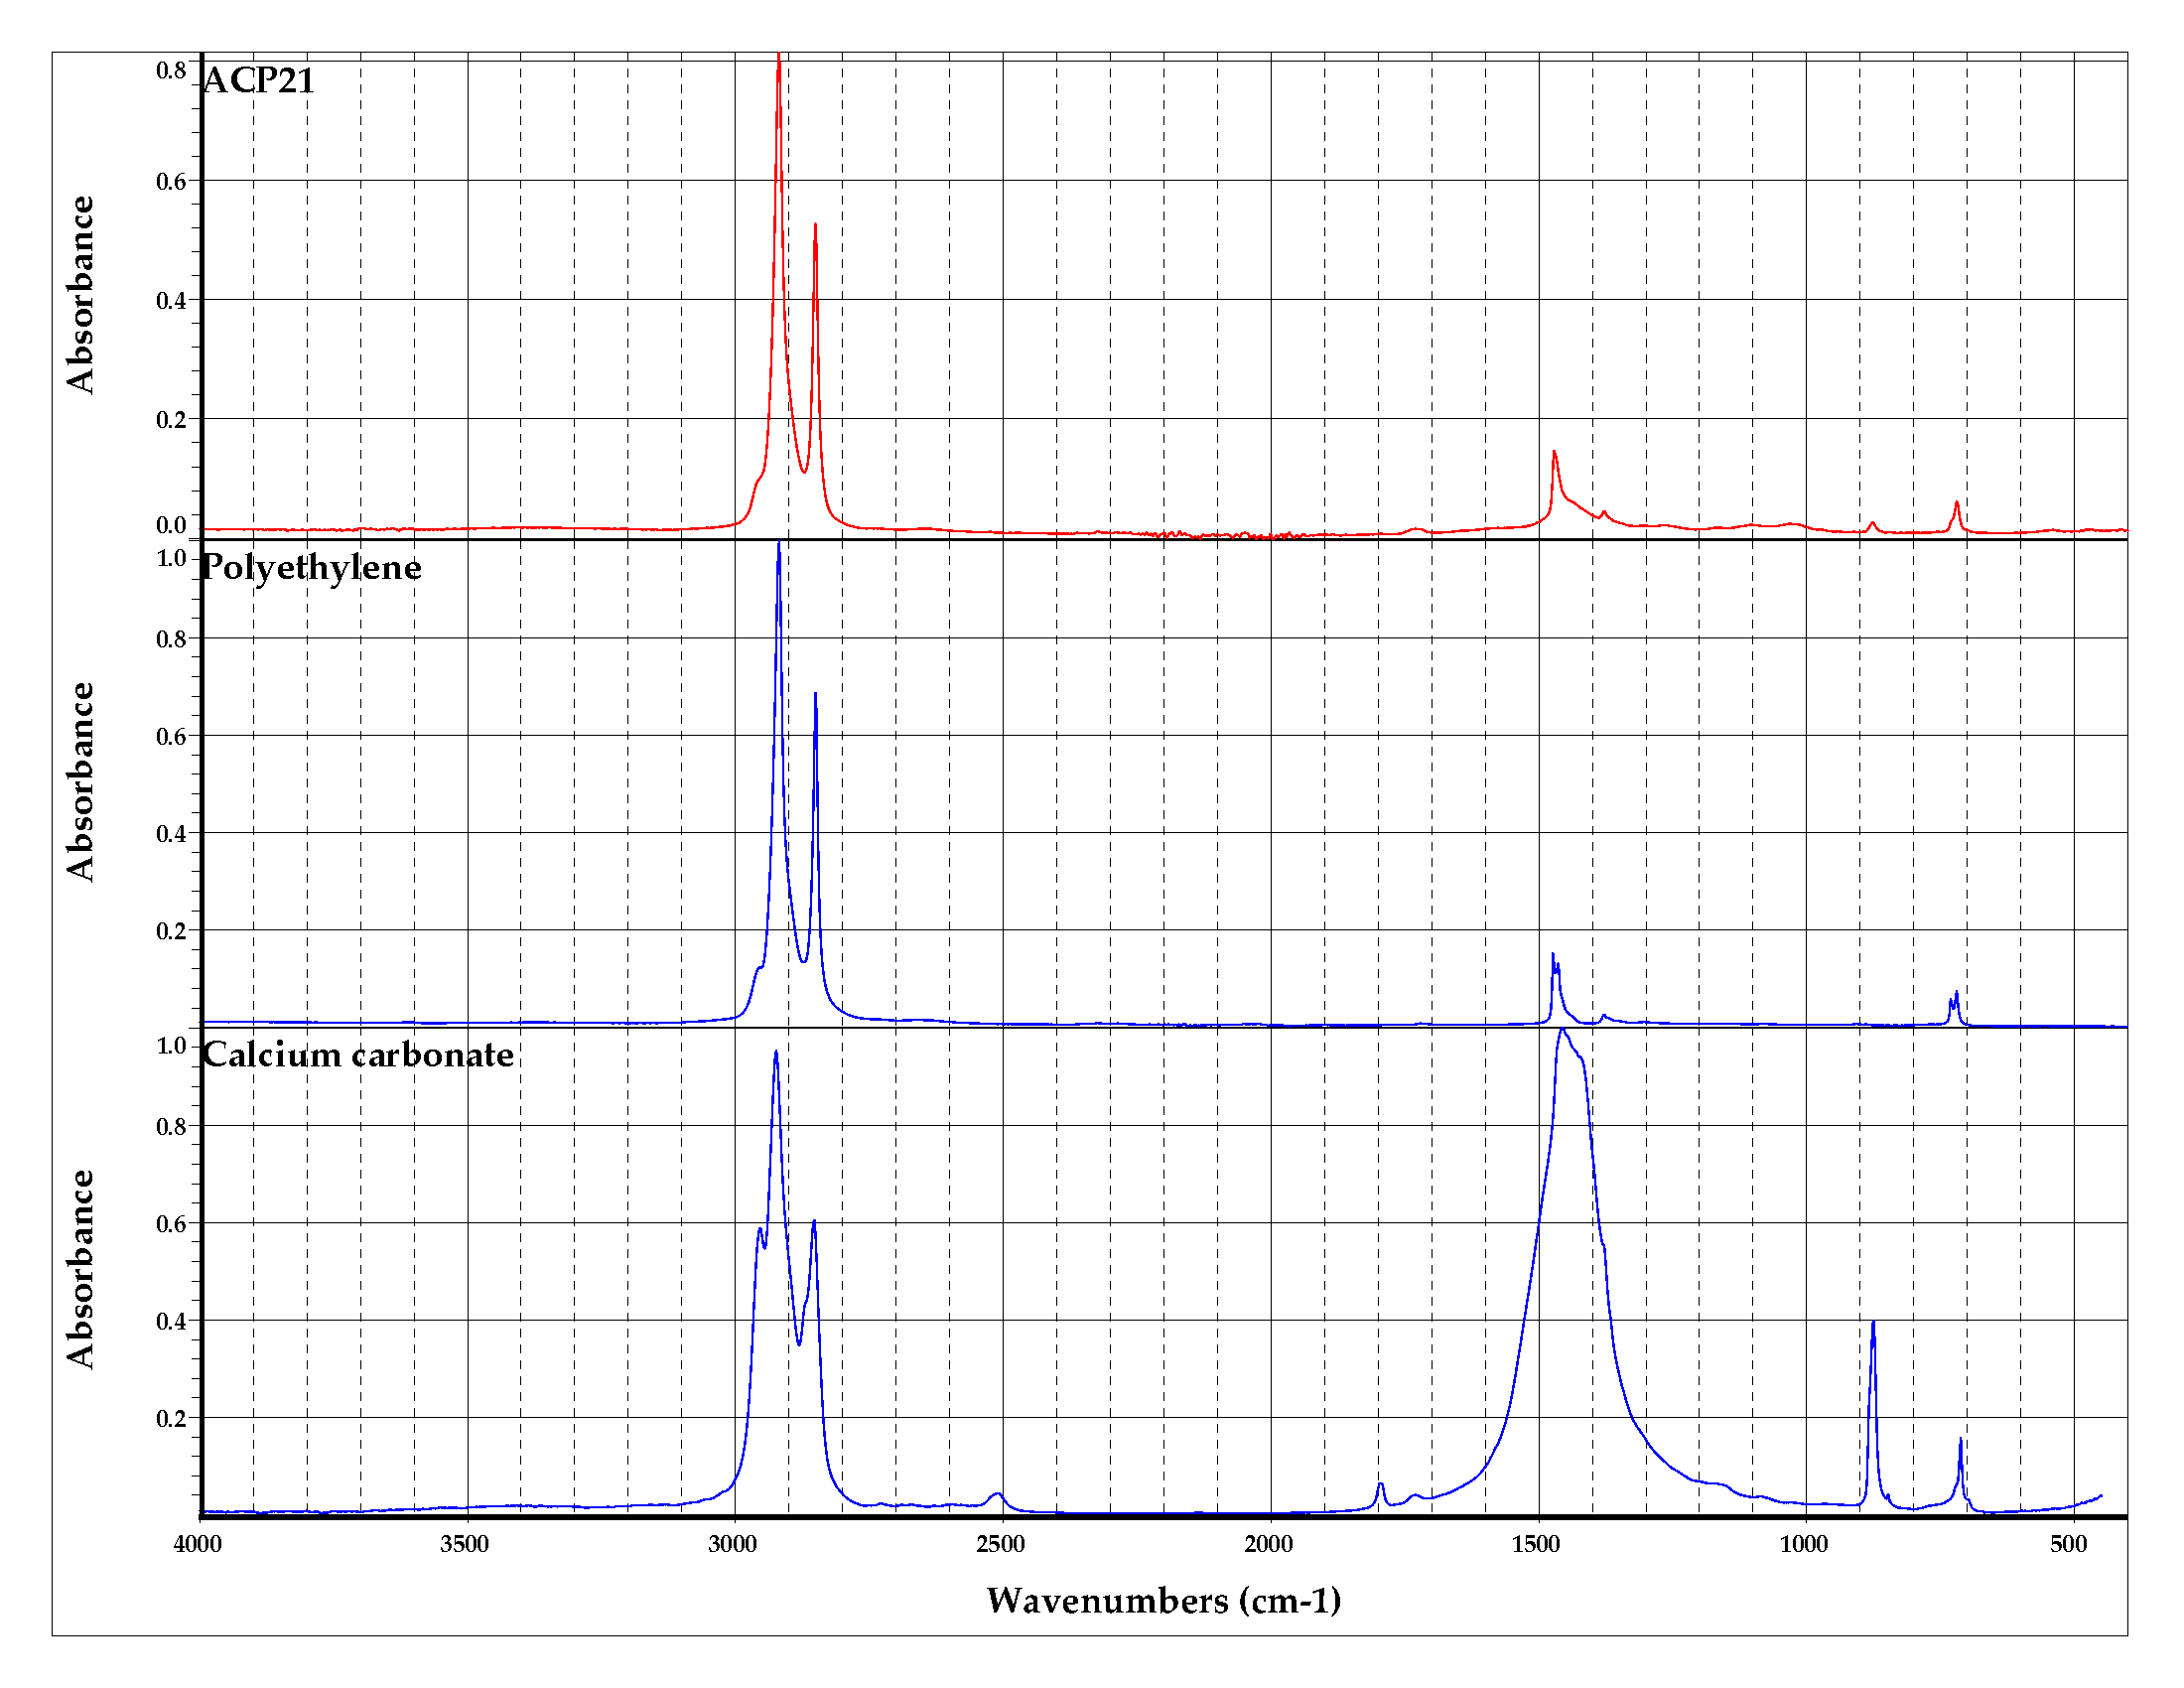
Figure 2. FTIR spectra: Absorbance percentage versus wavenumber from the sample and the identified compounds.
A.2 Energy Dispersive X-Ray Fluorescence (EDXRF)
Table 2. Inorganic elements and their mass concentration identified with EDXRF.
| Element | Mass Concentration (%) |
|---|---|
| Ca | 20 |
| Si | 1 |
| Mg | 1 |
| Cl | 1 |
| Ti | <1 |
| Fe | <1 |
| Al | <1 |
| K | <1 |
| Sc | <1 |
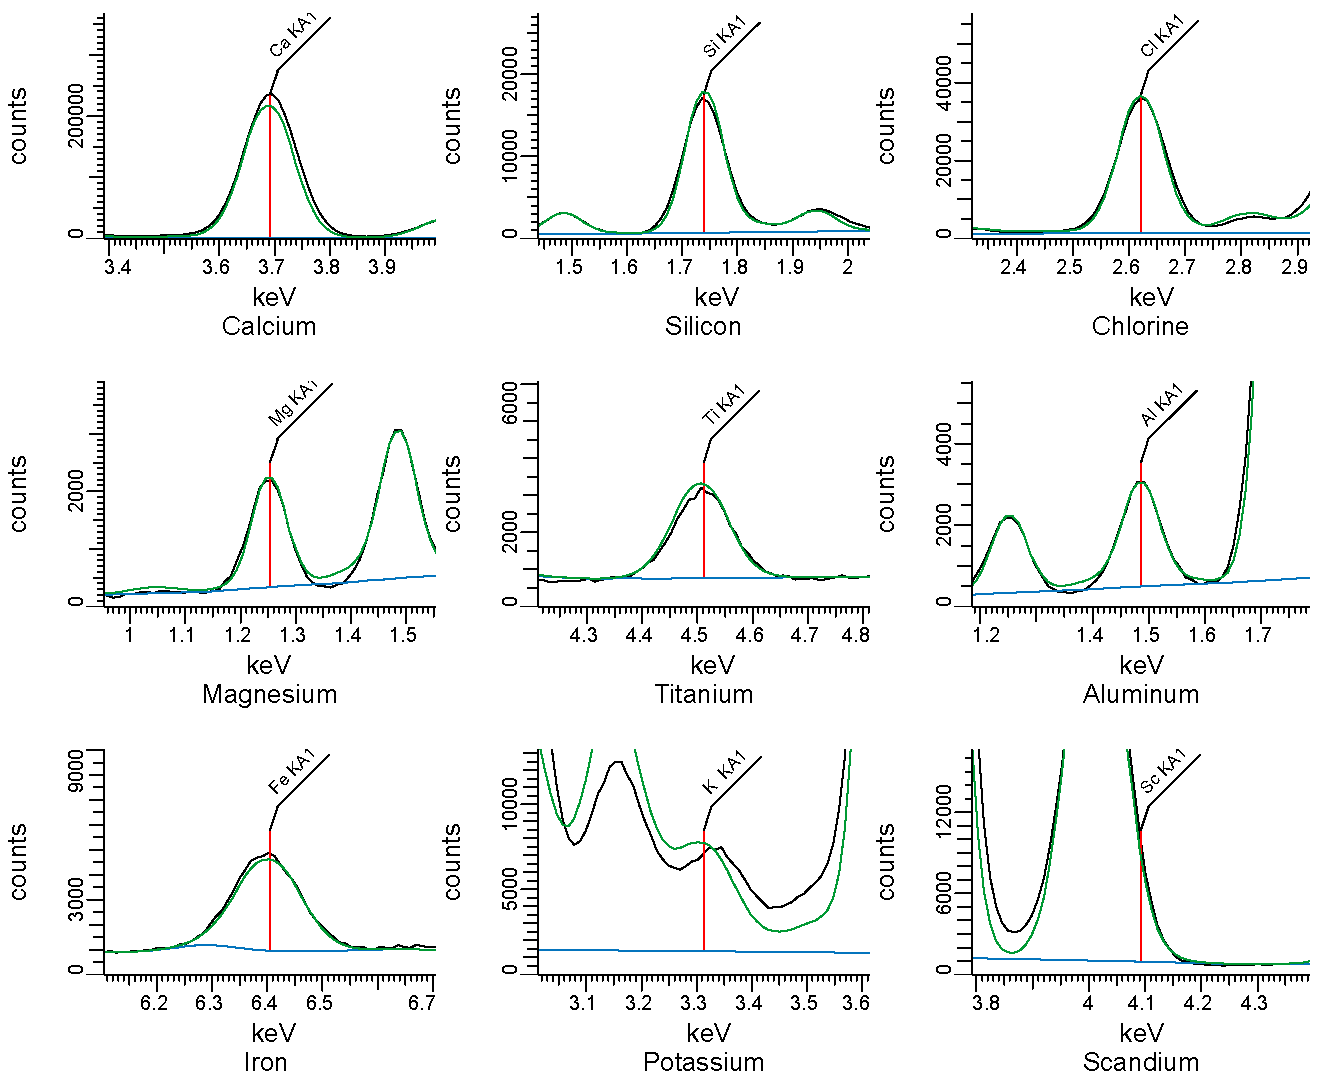
Figure 3. EDXRF spectra. Counts vs energy. Identified elements are shown as vertical lines.
B. Thermogravimetric analysis
Table 3. Mass fraction of residue after thermal decomposition.
| Condition | Fraction of mass residue at 800°C |
|---|---|
| Non-oxidative (nitrogen) | 0.13 |
| Oxidative (air) | 0.15 |
Table 4. Temperature and amplitude of main peaks in non-oxidative conditions.
| Peak ID | Temperature peak (°C) | Amplitude of peak (°C-1) |
|---|---|---|
| Peak 1 | 488 | 1.763 x 10⁻² |
| Peak 2 | 738 | 1.6 x 10⁻³ |
Table 5. Temperature and amplitude of main peaks in oxidative conditions.
| Peak ID | Temperature peak (°C) | Amplitude of peak (°C-1) |
|---|---|---|
| Peak 1 | 484 | 1.235 x 10⁻² |
| Peak 2 | 744 | 1.72 x 10⁻³ |
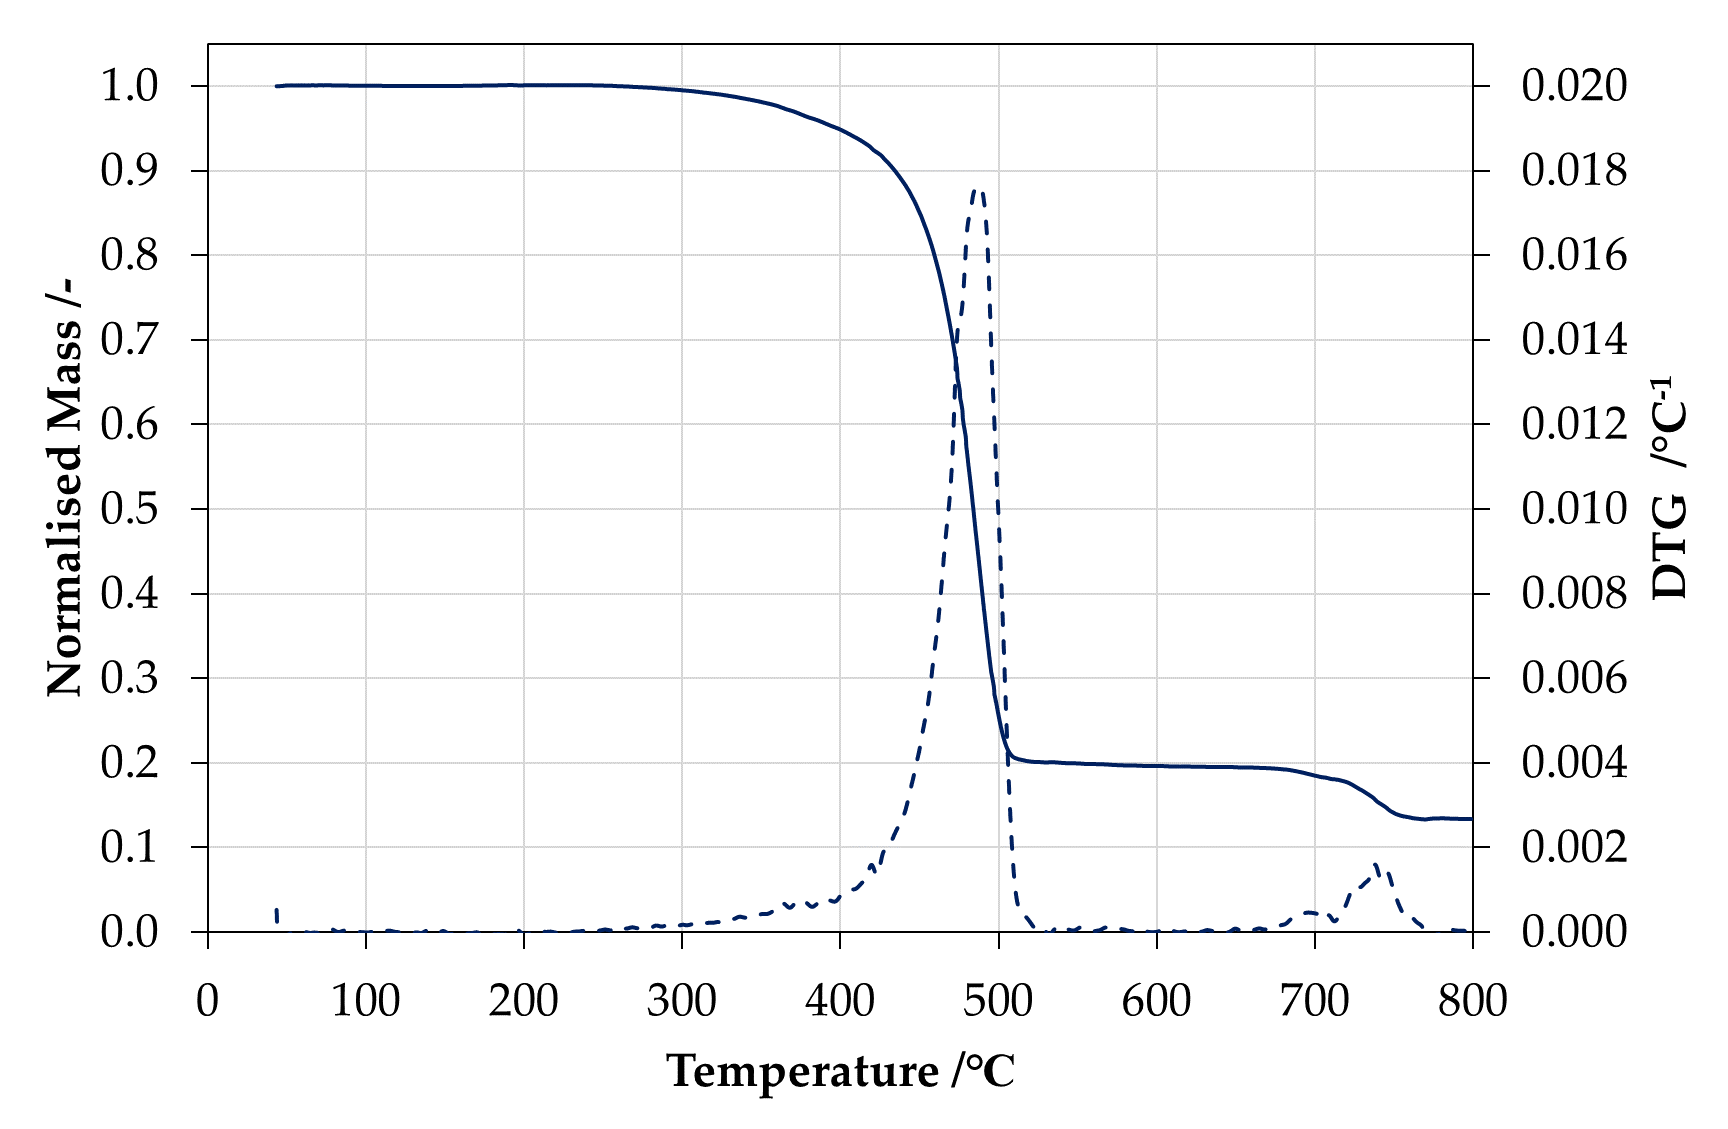
Figure 4. Normalised mass (solid line) and derivative of the normalised mass (dashed line) in 150 ml min-1 of nitrogen and a heating rate of 20°C min-1.
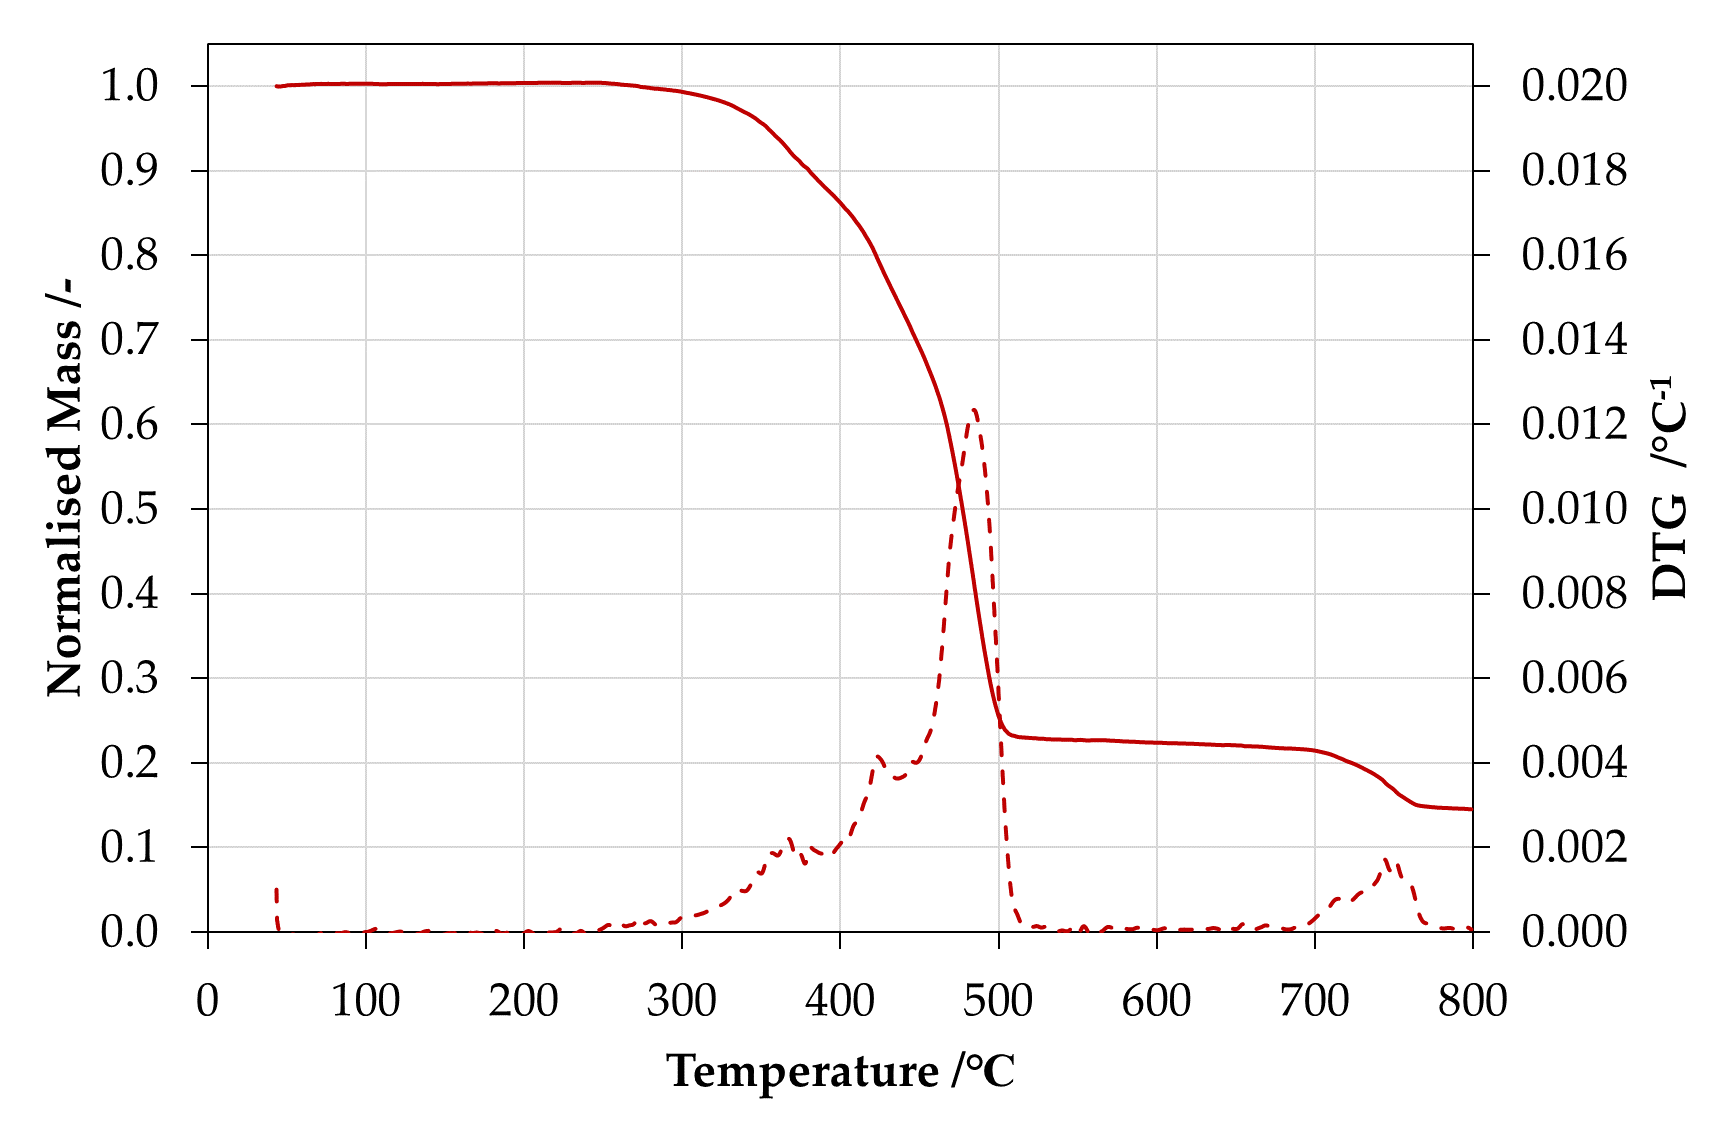
Figure 5. Normalised mass (solid line) and derivative of the normalised mass (dashed line) in 150 ml min-1 of air and a heating rate of 20°C min-1 .